

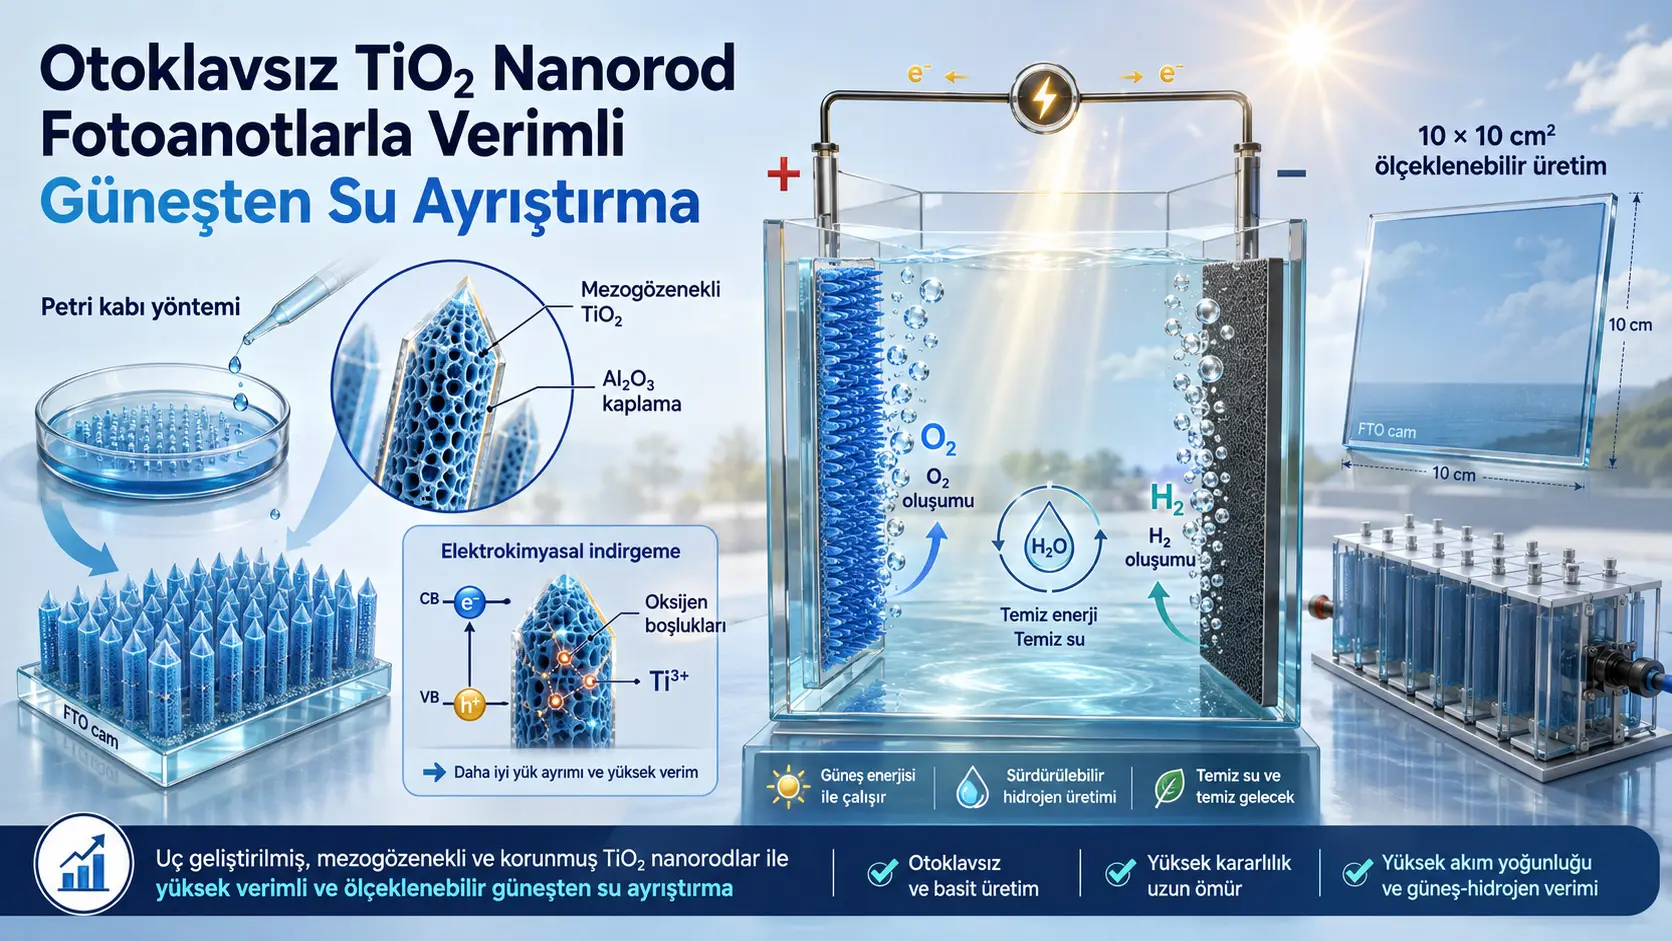
Ин таҳқиқот меомӯзад, ки оё бидуни истифодаи steel autoclave-и high-pressure истеҳсоли large-area titanium dioxide (TiO2) nanorod photoanodes имконпазир аст ё не. Researchers Petri-dish-based hydrothermal growth-ро, ки дар 100 °C барои 4 hours рӯйи FTO conductive glass иҷро мешавад, бо approximately 2 nm-thick Al2O3 surface passivation ва electrochemical reduction process муттаҳид кардаанд. Optimized TiO2/Al2O3-ER photoanode дар potential-и 1,23 VRHE ба photocurrent density-и 2,35 mA cm-2 ва surface charge separation efficiency-и %96,7 расидааст. Бо вуҷуди ин, measurements дар three-electrode laboratory cell бо external potential анҷом дода шудаанд; unbiased full-cell solar-to-hydrogen efficiency ва quantitative hydrogen production rate муайян нашудаанд.
First stage of production method rutile TiO2 nanorod arrays бо porous and tapered tips ба вуҷуд овардааст. Мувофиқи mechanism-и пешниҳодкардаи authors, high-curvature tips local electric field-ро тақвият дода, transport-и OH- ions ба active regions ва oxygen evolution reaction-ро осон мекунанд. Mesopores-и reported дар nanorods, ки дар range-и 5–35 nm мебошанд, electrode-electrolyte contact ва electrochemically active surface area-ро зиёд мекунанд. Local electric-field mechanism бо direct field measurement ё numerical electric-field map тасдиқ нашуда; аз shape ва performance results пешниҳод шудааст.
Approximately 2 nm amorphous Al2O3 coating surface defects-ро passivate карда, recombination-и photogenerated charges-ро дар surface кам кардааст. Subsequent electrochemical reduction oxygen-vacancy/Ti3+ ratios-ро зиёд карда, electron transport ва interfacial charge transfer-ро беҳтар кардааст. Photocurrent аз 1,72 mA cm-2 дар bare TiO2 photoanode ба 2,03 mA cm-2 with Al2O3 coating ва пас аз reduction process ба 2,35 mA cm-2 расидааст.
Optimized photoanode пас аз 50 hours continuous illumination %96,8-и initial photocurrent-ро нигоҳ дошт. Ғайр аз ин, 10 × 10 cm2 photoanode истеҳсол шуд ва дар setup бо three electrodes stacked in parallel total current density 3,82 mA cm-2 measured шуд. Аммо photocurrent distribution across full area of 100 cm2 sample, total gas production, large-area stability ва mass-production cost measured нашудаанд. Аз ин рӯ study барои scale-up як important manufacturability demonstration медиҳад, аммо industrial application-ро ҳанӯз тасдиқ намекунад.
Масъалаи асосии таҳқиқот чист?
Photoelectrochemical water splitting як energy-conversion method аст, ки ҳадаф дорад semiconductor electrodes бо истифода аз light energy обро ба hydrogen ва oxygen ҷудо кунанд. Oxygen evolution reaction дар photoanode ва hydrogen evolution reaction дар counter-electrode side рух медиҳад.
When a photoanode absorbs light, electron-hole pairs ташкил мешаванд. Барои он ки electrons ва holes дар useful reactions иштирок кунанд, following stages бояд якҷоя effective бошанд:
- Absorption of light by semiconductor,
- Separation of electrons and holes inside material,
- Transport of charges to relevant surface without recombination,
- Oxidation of water or OH- ions by holes reaching surface,
- Transfer of generated electrons through external circuit to counter electrode.
TiO2 due to low cost, chemical stability ва relatively environmentally suitable structure яке аз most common photoanode materials мебошад. Дар муқобил, wide band gap utilization of large portion of sunlight-ро маҳдуд мекунад. Low carrier mobility ва surface defects низ метавонанд electron-hole recombination-ро пеш аз useful reaction ба вуҷуд оранд.
Second problem of study production scale мебошад. Conventional hydrothermal nanorod production одатан дар closed autoclaves resistant to high pressure анҷом дода мешавад. Autoclave volume метавонад size of FTO glass that can be processed-ро маҳдуд кунад. Alternatives such as vapor deposition equipment-и more complex or expensive талаб мекунанд.
Researchers therefore address two problems together:
- Can large-area and uniform TiO2 nanorod photoanode be produced without autoclave?
- How can charge separation, surface reaction and stability be improved while preserving scalable production?
Three-part improvement strategy proposed by study
Study relies not on single modification but on three complementary structural and chemical interventions:
| Strategy | Targeted problem | Proposed function |
|---|---|---|
| Tapered-tip and mesoporous TiO2 nanorods | Limited active area and slow surface reaction | Increase local electric field and electrode-electrolyte contact area |
| Ultrathin Al2O3 coating | Charge recombination at surface defects | Passivate surface defects and limit back electron transfer |
| Electrochemical reduction | Low conductivity and slow charge transfer | Increase carrier density by generating oxygen vacancies and Ti3+ species |
These three components are not responsible for same physical effect. Al2O3 is aimed mainly at surface passivation, while reduction process focuses on defect engineering in bulk and near-surface regions of material. Mesoporous architecture changes reaction-accessible area and transport pathways.
Petri-dish-based production method
FTO is fluorine-doped tin oxide-coated conductive glass and was used as light-facing electrical substrate of photoanode. FTO samples were first ultrasonically cleaned in deionized water, ethanol and acetone.
Hydrothermal solution was prepared with:
- 30 mL deionized water,
- 20 mL ethanol,
- 50 mL hydrochloric acid at %36–38 concentration,
- 4,5 mL titanium butoxide.
Water and ethanol were mixed with hydrochloric acid; after five minutes stirring titanium butoxide was added and stirring continued for another ten minutes. FTO glass was immersed in solution and kept at 100 °C for four hours in electric furnace.
At this stage glass Petri dish was used instead of conventional stainless-steel autoclave. Although process does not require high-pressure autoclave, entire production route is not low-temperature. After washing, nanorods were annealed at 750 °C for 30 minutes to improve crystal structure.
Role of ethanol in production
Addition of 20 mL ethanol to precursor solution was found critical for photocurrent performance. Value without ethanol or under unsuitable condition was 0,77 mA cm-2, while optimized ethanol amount gave 1,72 mA cm-2.
Researchers state ethanol replaces part of water and facilitates dense TiO2 film growth in shorter time. Detailed curves for different ethanol amounts are referred to Figure S9, but supporting figure is not included in uploaded file.
How was Al2O3 passivation layer prepared?
TiO2 nanorod-coated FTO was immersed in 5 mM Al(NO3)3 aqueous solution for four minutes. Sample was then annealed in air at 200 °C for one hour.
It is stated that when immersion time is very short surface may not be fully covered; when too long, pores can close, light absorption can weaken and charge-transfer resistance can increase. Detailed time optimization is given in Figure S11, but corresponding figure is not included in uploaded PDF.
How was electrochemical reduction applied?
TiO2/Al2O3 photoanodes were reduced in 1 M KOH at constant potential -0,5 V versus Ag/AgCl reference electrode. Examined times were 0, 30, 60, 120 and 180 seconds.
Aim of process is removing oxygen from TiO2 lattice to create oxygen vacancies and reducing part of Ti4+ species to Ti3+ state. It is stated excessively long reduction can cause excessive defect formation and deterioration of crystal integrity.
Exact reduction time of optimized final sample is not written explicitly in main text and is referred to optimization in Figure S12. Since supporting figure is absent from uploaded file, duration has not been inferred.
Nanorod morphology
SEM images report nanorods approximately 400–600 nm long and 100–170 nm in diameter. Label in cross-sectional SEM image indicates total film thickness approximately 862 nm. Difference between individual nanorod length and total coating thickness may be related to growth arrangement on substrate and total layer measured in image; study does not separately reconcile these two measurements.
In top view, nanorods are densely packed and form array with rounded or tapering tips. Cross-sectional image shows nanorods attached to FTO surface and growing largely in vertical direction.
TEM image shows nanorod structure aggregated and forming two tapered tips. Authors emphasize this geometry differs from conventional quadrangular column-shaped TiO2 nanorods.
What does tapered-tip effect mean?
Concentration of electric field lines at sharp high-curvature tips is called “tip effect.” In mechanism schematic, this field is proposed to direct OH- ions toward active regions near tip and accelerate oxygen evolution reaction.
Proposed process can be summarized:
- Light generates electrons and holes in TiO2.
- Holes are transported to photoanode surface.
- Local field near tapered tip facilitates transport of charged species and accumulation of OH-.
- Surface holes oxidize OH- species and contribute to O2 formation.
This mechanism is consistent with performance increase; however, study does not directly measure electric-field intensity around tip, provide quantitative field map from finite-element simulation, or separately compare tipped versus untipped nanorods with same chemistry. Therefore contribution of tip effect cannot be fully separated from total effect of overall architecture.
Mesoporous structure
HAADF-STEM images show many bright and dark pore regions inside nanorods. Based on supporting pore-distribution analysis, pore diameters are reported mostly between 5–35 nm.
Three contributions are proposed for mesoporous architecture:
- Increase surface area in contact with electrolyte,
- Create more surface reaction sites,
- Reduce distance over which charges and reaction species must be transported.
Because Figure S3 containing pore-diameter distribution is not included in uploaded PDF, histogram shape, sample count and distribution uncertainty could not be independently examined.
Microscopic evidence for Al2O3 layer
HRTEM image shows approximately 2 nm-thick amorphous Al2O3 layer covering TiO2 nanorod surface. Coating is interpreted as amorphous because it does not show crystal fringes.
Average lattice-fringe spacing in TiO2 was measured as 0,313 nm and assigned to rutile TiO2 (110) plane. In peak-intensity profile, sum of approximately ten lattice spacings is shown as 3,13 nm.
HAADF-STEM and EDS maps show Ti, O and Al signals along nanorod. Distribution of Al signal along nanorod surface and general shape supports coating over broad scale. However, spatial resolution of EDS mapping does not demonstrate coating is exactly 2 nm at every point; thickness was measured from selected local HRTEM region.
Crystal structure and strain relaxation
XRD patterns identified dominant phase of all photoanodes as rutile TiO2. Other prominent peaks belong to tetragonal SnO2 phase of FTO substrate. No separate diffraction peak observed for amorphous and ultrathin Al2O3 layer.
TiO2 (101) and (211) peaks shifted to lower 2θ angles after Al2O3 coating and low-temperature annealing. Authors explain this shift by strain relaxation:
- Initial annealing at 750 °C and rapid cooling can generate residual compressive strain due to thermal mismatch and phase transformation between TiO2 and FTO.
- Second annealing at 200 °C can allow lattice atoms to relax into lower-energy positions.
- Al–O–Ti bonds can alter surface boundary conditions and contribute to redistribution of strain.
Study did not directly quantify residual stress using Raman shift, curvature measurement or mechanical-stress analysis. XRD peak shifts are main evidence of structural change.
Light absorption and band gap
In UV-vis spectra, reduced TiO2/Al2O3-ER sample showed highest absorption. Spectra contain absorption tail extending into visible region.
Tauc plots mark optical transition value approximately 3,01 eV for bare TiO2 and approximately 2,89 eV for reduced photoanode. Authors associate change with Ti3+ species and oxygen vacancies created after electrochemical reduction, which form defect levels within band gap.
Additional absorption in visible region does not mean all these photons are converted to useful current with equal efficiency. IPCE results show highest conversion remains predominantly in 350–420 nm ultraviolet and near-ultraviolet region.
Oxygen vacancies and Ti3+ species
O 1s XPS spectra were separated into three components:
- Approximately 529,6 eV: lattice oxygen,
- Approximately 531,2 eV: oxygen-vacancy-related component,
- Approximately 532,5 eV: chemically adsorbed oxygen.
| Sample | Oxygen vacancy/lattice oxygen ratio | Ti3+/Ti4+ ratio |
|---|---|---|
| TiO2 | %15,7 | %7,3 |
| TiO2/Al2O3 | %17,9 | %6,0 |
| TiO2/Al2O3-ER | %22,7 | %12,6 |
After Al2O3 coating, oxygen-vacancy-related ratio increased while Ti3+ ratio slightly decreased. Authors explain this by charge balancing at Al–O–Ti interface and local structural change around Ti4+ by Al3+ species.
After electrochemical reduction, both oxygen-vacancy and Ti3+ ratios clearly increased. Shift of Ti 2p peaks to lower binding energy also supports increased Ti3+ content. Al 2p peak at approximately 74,1 eV is assigned to presence of Al2O3 with Al3+ state.
Photoelectrochemical measurement setup
Performance measurements were carried out in a three-electrode cell:
- Working electrode: TiO2 photoanode illuminated over 1 cm2,
- Reference electrode: Ag/AgCl containing 3,0 M NaCl,
- Counter electrode: Platinum plate,
- Electrolyte: 1 M NaOH,
- Light: AM 1.5G, 100 mW cm-2 simulated sunlight.
Three-electrode cell is appropriate for detailed study of potential-dependent photoanode behavior. However, this setup is not a completed solar-hydrogen device operating without external voltage. Therefore photocurrent density and applied-bias efficiency should not be equated directly with full-system solar-to-hydrogen efficiency.
Conversion of potentials to RHE scale
Potentials measured versus Ag/AgCl reference were converted to reversible hydrogen electrode scale using:
\[ E_{\mathrm{RHE}}=E_{\mathrm{Ag/AgCl}}+0{,}059\,\mathrm{pH}+E_{\mathrm{Ag/AgCl}}^{0} \]
At 25 °C:
\[ E_{\mathrm{Ag/AgCl}}^{0}=0{,}1976\ \mathrm{V} \]
- ERHE: Potential versus reversible hydrogen electrode,
- EAg/AgCl: Potential measured versus Ag/AgCl reference,
- pH: Acidity-basicity value of electrolyte,
- E0Ag/AgCl: Standard potential of reference electrode.
Mott-Schottky equation and notation issue in text
Equation given in study to calculate charge-carrier density is printed in PDF as:
\[ \left(\frac{A_S}{C_{\mathrm{bulk}}}\right)= \frac{2}{q\varepsilon_r\varepsilon_0N_D} \left(V-E-\frac{k_BT}{q}\right) \]
- AS: Surface-area correction,
- Cbulk: Space-charge capacitance,
- ND: Donor or carrier density,
- V: Applied potential,
- kB: Boltzmann constant,
- T: 298 K,
- q: Elementary electric charge,
- ε0: Vacuum permittivity,
- εr: Relative permittivity taken as 170 for TiO2.
Although text explains energy term in equation as flat-band potential EFB, equation writes only E. Also capacitance term is printed without square in PDF. Equation has not been silently corrected here; this internal notation inconsistency, potentially important for reproducibility, is stated explicitly.
Photon-to-current conversion efficiency
Wavelength-dependent incident photon-to-current efficiency was calculated with:
\[ \mathrm{IPCE}= \frac{1240\,J} {P_{\mathrm{light}}\lambda} \]
- J: Photocurrent density measured under monochromatic light, mA cm-2,
- Plight: Light power at relevant wavelength, mW cm-2,
- λ: Wavelength of incident light, nm,
- 1240: Coefficient from conversion between photon energy and wavelength.
IPCE expresses what fraction of incident photons at a given wavelength is converted to measurable electrical current. It is not hydrogen-production efficiency of full cell.
Applied-bias photon-to-current efficiency
Study gives applied-bias photon-to-current efficiency as:
\[ \mathrm{ABPE}= \frac{J_{\mathrm{ph}}\left(1{,}23-E\right)} {P_{\mathrm{irradiation}}} \]
- Jph: Photocurrent density,
- 1,23 V: Thermodynamic potential used for water splitting,
- E: Potential applied to photoanode,
- Pirradiation: Incident light power density.
ABPE is a photoelectrode metric accounting for externally applied electrical bias. It is not solar-to-hydrogen efficiency of a device operating without external voltage.
Optimization of synthesis conditions
Highest bare TiO2 performance for Petri-dish method was obtained under:
- 4,5 mL titanium butoxide,
- 20 mL ethanol,
- 100 °C hydrothermal temperature,
- 4 hours growth time,
- Annealing at 750 °C for 30 minutes.
Under these conditions bare TiO2 photoanode produced 1,72 mA cm-2 photocurrent at 1,23 VRHE. Comparison table in study gives values 0,32–0,96 mA cm-2 for some TiO2 nanorod photoanodes prepared by conventional autoclave.
Although title of Table 1 refers to photoanodes synthesized by autoclave, first row also includes current autoclave-free study. This is inconsistency in table-title scope; it does not alter numerical values but should be considered in interpretation.
Improvement in photocurrent density
| Photoanode | Photocurrent density at 1,23 VRHE | Main modification |
|---|---|---|
| Comparison TiO2 prepared by conventional method | 0,54 mA cm-2 | Comparison example given in study |
| TiO2 by Petri-dish method | 1,72 mA cm-2 | Tapered-tip and mesoporous nanorod architecture |
| TiO2/Al2O3 | 2,03 mA cm-2 | Surface passivation |
| TiO2/Al2O3-ER | 2,35 mA cm-2 | Oxygen-vacancy and Ti3+ engineering |
Bare photoanode produced by Petri-dish method gave approximately 3,2 times higher photocurrent than conventional TiO2 comparison in study. Additional increase from Al2O3 coating was approximately 0,31 mA cm-2, and additional contribution of electrochemical reduction approximately 0,32 mA cm-2.
This comparison shows sequential sample modifications. Because separate untapered control with same porosity or nonporous control with same tip geometry was not prepared, effects of two morphology components were not fully separated.
ABPE results
| Photoanode | Highest ABPE | Corresponding potential |
|---|---|---|
| TiO2 | %0,76 | 0,55 VRHE |
| TiO2/Al2O3 | %1,08 | 0,47 VRHE |
| TiO2/Al2O3-ER | %1,34 | 0,47 VRHE |
Al2O3 and reduction process increased ABPE peak and enabled it at lower applied potential compared with bare TiO2.
Carrier density and flat-band potential
| Photoanode | Carrier density ND | Flat-band potential |
|---|---|---|
| TiO2 | 1,03 × 1017 cm-3 | 0,086 VRHE |
| TiO2/Al2O3 | 1,73 × 1017 cm-3 | 0,061 VRHE |
| TiO2/Al2O3-ER | 1,84 × 1017 cm-3 | 0,076 VRHE |
Increase in carrier density after Al2O3 was associated with reduction of surface traps and increase of available carriers. Electrochemical reduction further increased carrier density.
These values were calculated from Mott-Schottky slope using relative permittivity assumed constant for TiO2 and ideal space-charge approach. Therefore they are not direct carrier counts and depend on model assumptions.
Impedance results
Photoelectrochemical impedance spectroscopy was performed at 0,25 VRHE, frequency range 0,1 Hz–100 kHz and under one-sun illumination. Nyquist curves were fitted with equivalent circuit containing two RC units.
Al2O3 coating reduced interfacial charge-transfer resistance while largely preserving trap-related resistance. Authors interpret this result as coating acting predominantly at surface.
After electrochemical reduction, both interfacial charge-transfer resistance and trap resistance decreased. This supports interpretation that reduction process changes not only surface reaction but also carrier transport inside material.
Full numerical parameters of equivalent circuit are referred to Figure S13, but supporting figure is absent from file. Therefore numerical values of resistances and capacitances could not be transferred from main PDF.
Open-circuit photovoltage
Open-circuit potential difference between dark and illuminated states was measured as:
| Photoanode | ΔOCP |
|---|---|
| TiO2 | 297 mV |
| TiO2/Al2O3 | 520 mV |
| TiO2/Al2O3-ER | 550 mV |
Larger photovoltage was associated with greater charge separation under illumination and higher carrier accumulation at surface. Large increase after Al2O3 coating indicates limiting surface recombination is one of main contributions.
Wavelength-dependent IPCE
All photoanodes showed highest IPCE values in 350–420 nm range. At approximately 350 nm:
- TiO2: approximately %42,
- TiO2/Al2O3: approximately %48,
- TiO2/Al2O3-ER: approximately %50.
In 360–390 nm range IPCE of reduced sample at some points was slightly lower than only Al2O3-coated sample. In contrast, in 390–550 nm range oxygen-vacancy and Ti3+-related states appear to contribute more clearly to reduced sample.
Calculated photocurrents from integration of IPCE spectrum against AM 1.5G solar spectrum:
- TiO2: 1,73 mA cm-2,
- TiO2/Al2O3: 2,03 mA cm-2,
- TiO2/Al2O3-ER: 2,36 mA cm-2.
These values agree closely with J–V measurements of 1,72; 2,03 and 2,35 mA cm-2.
Surface and bulk charge separation efficiencies
To separate surface and bulk contributions, 0,5 M Na2SO3 hole scavenger was added to 1 M NaOH electrolyte.
Surface charge separation efficiency expresses what fraction of holes reaching photoanode surface participate in water oxidation without recombining.
Bulk charge separation efficiency expresses what fraction of holes generated inside material can reach surface without recombining in bulk.
| Photoanode | Surface efficiency, 1,23 VRHE | Bulk efficiency, 1,23 VRHE |
|---|---|---|
| TiO2 | %82,1 | %21,8 |
| TiO2/Al2O3 | %89,7 | %23,5 |
| TiO2/Al2O3-ER | %96,7 | %25,3 |
Largest improvement occurred in surface efficiency. This shows major part of performance increase is associated with passivation of surface defects and improved interfacial charge transfer. Increase in bulk efficiency is more limited.
Authors describe %96,7 as record-level surface charge separation efficiency. Study does not provide comprehensive systematic meta-analysis supporting this “record” claim; therefore phrase should be read as authors’ literature assessment.
Electrochemically active surface area
Double-layer capacitance was calculated from cyclic-voltammetry curves:
| Photoanode | Cdl | Calculated ECSA |
|---|---|---|
| TiO2 | 7,27 µF cm-2 | 0,18 cm2 |
| TiO2/Al2O3 | 7,86 µF cm-2 | 0,20 cm2 |
| TiO2/Al2O3-ER | 13,68 µF cm-2 | 0,34 cm2 |
ECSA was calculated as:
\[ \mathrm{ECSA}=\frac{C_{\mathrm{dl}}}{C_s} \]
where specific capacitance was assumed:
\[ C_s=40\ \mu\mathrm{F\,cm^{-2}} \]
.
Double-layer capacitance of reduced sample is 1,74 times that of only Al2O3-coated sample and 1,88 times that of bare TiO2. ECSA is not absolute geometric surface measurement; it is indirect comparison based on assumed specific capacitance.
50-hour stability
| Photoanode | Photocurrent retained after 50 hours |
|---|---|
| TiO2 | %79,8 |
| TiO2/Al2O3 | %89,5 |
| TiO2/Al2O3-ER | %96,8 |
Al2O3 layer is proposed to partially isolate surface from electrolyte and limit photocorrosion and side reactions; reduction process is proposed to improve charge transfer and coating-substrate interface.
Fifty-hour test is meaningful laboratory-scale stability indicator, but does not represent months or years of solar-hydrogen operation. No detailed degradation analysis was given in which microstructure, Al dissolution, oxygen-vacancy density or gas-production efficiency were remeasured after test.
Parallel photoanode stack
Using short and partially light-transmitting nanorod films, arrangement with one, two and three photoanodes placed in parallel was prepared.
| Number of photoanodes | Total photocurrent density, 1,23 VRHE | Contribution of added layer |
|---|---|---|
| 1 | 2,35 mA cm-2 | 2,35 mA cm-2 |
| 2 | 3,34 mA cm-2 | 0,99 mA cm-2 |
| 3 | 3,82 mA cm-2 | 0,48 mA cm-2 |
Each added electrode increased total current, but contribution progressively decreased. Because upper layers absorb and scatter light, less light reaches second photoanode and still less reaches third.
While triple setup operated, oxygen bubbles at photoanodes and hydrogen bubbles at platinum cathode were visually shown. However, gas chromatography, volumetric gas measurement, H2:O2 stoichiometry or Faradaic efficiency were not reported. Bubble image supports gas formation but does not provide quantitative hydrogen-production efficiency.
10 × 10 cm2 photoanode
Using Petri-dish method, TiO2-coated FTO sample measuring 10 × 10 cm2 was prepared. Photograph shows coating spread macroscopically across entire surface, while printed patterns beneath remain visible.
This demonstration supports processing larger substrates independent of autoclave volume. However, study does not provide following measurements for large-area sample:
- Photocurrent density across entire 100 cm2 area,
- Center-edge thickness and morphology map,
- Electrical resistance across area,
- Total hydrogen and oxygen production rate,
- Large-area stability test,
- Production yield or defective-sample fraction.
Therefore 10 × 10 cm2 sample shows physical feasibility of large-area growth; it does not prove 100 cm2 device operates with same efficiency as small sample.
Technical interpretation of Figure 1
Top row of Figure 1 sequentially shows Petri-dish nanorod growth, annealing at 750 °C, Al(NO3)3 coating and electrochemical reduction steps.
SEM images show dense nanorod array and approximately 862 nm total film thickness; TEM image shows tapered-tip, aggregated and porous nanorod. HRTEM shows rutile (110) lattice spacing together with approximately 2 nm Al2O3 boundary. Elemental maps in bottom row visualize Ti, O and Al distributions.
Technical interpretation of Figure 2
In XRD graphs rutile TiO2 main phase is retained, while selected peak shifts to lower angle are associated with strain relaxation. UV-vis and Tauc plots show reduced sample has broader optical absorption and lower calculated transition energy.
O 1s and Ti 2p XPS deconvolutions show oxygen-vacancy- and Ti3+-related components increase after electrochemical reduction. Al 2p peak is one chemical evidence of Al2O3 coating.
Technical interpretation of Figure 3
In J–V curves, black TiO2, red TiO2/Al2O3 and blue TiO2/Al2O3-ER curves show sequential performance increase.
Tip-effect schematic shows OH- ions directed toward high-electric-field nanorod tip and O2 formation. Reduced sample has highest peak in ABPE graph. Mott-Schottky, impedance and OCP graphs complementarily show improvements in carrier density, charge transfer and photovoltage.
In literature-comparison graph, bare TiO2 value of study, 1,72 mA cm-2, is shown higher than selected references. This comparison is limited to studies selected in paper and reported under similar conditions; it is not a systematic review of entire TiO2 literature.
Technical interpretation of Figure 4
IPCE graph shows performance concentrated mainly in ultraviolet region. Surface-separation-efficiency curves place reduced sample highest across nearly entire potential range, while differences among bulk-efficiency curves are smaller.
In double-layer capacitance graph, slope of reduced sample is markedly larger. In fifty-hour stability graph, blue curve remains high and relatively flat while bare TiO2 curve continuously declines.
Bottom mechanism schematic shows residually strained TiO2 after high-temperature annealing, Al–O–Ti/Al2O3 formation after Al(NO3)3 treatment, and increase in Ti3+ and oxygen vacancies after electrochemical reduction.
Technical interpretation of Figure 5
J–V curves of one-, two- and three-layer photoanodes show total current increases with layer count, but increase is nonlinear. Layer-contribution graph clearly shows progressively declining share of second and third electrode.
Gas bubbles are visible on electrode surfaces in photograph of operating cell. Large-area photograph shows macroscopic appearance of coating on 10 × 10 cm2 substrate.
Message of graphical abstract
Graphical abstract compares 10 cm-size photoanode and Petri-dish method with selected photocurrent values from conventional autoclave studies. Right side shows tapered TiO2 nanorod, Al2O3 coating and OH-–O2 conversion near tip.
Graphical abstract emphasizes two main claims together: autoclave-free method suitable for larger-substrate production and enhanced PEC performance through high-area/pore/passivation/defect engineering.
Strengths of study
- An open and relatively simple growth approach not requiring high-pressure autoclave was developed.
- Production parameters were optimized in terms of precursor amount, ethanol, temperature, time and annealing.
- Morphology, surface chemistry, crystal structure and electrochemical performance were examined with many complementary methods.
- Tapered tips, mesopores, surface passivation and internal defect engineering were combined in same photoanode.
- Approximately 2 nm Al2O3 coating was directly imaged by HRTEM.
- Increase in oxygen vacancies and Ti3+ was quantitatively compared by XPS.
- Photocurrent, ABPE, IPCE, Mott-Schottky, impedance, OCP, charge-separation efficiency and ECSA provide mutually supporting performance picture.
- Photocurrent calculated from IPCE and J–V measurement were found very close.
- Surface and bulk charge separation were evaluated separately.
- Fifty-hour stability measurement was performed.
- Total current of triple parallel stack and contribution of each added electrode were given separately.
- 10 × 10 cm2 photoanode was physically produced.
Limitations of study
- Study is a preprint that has not undergone peer review.
- Supporting Figures S1–S16 are not included in uploaded file.
- Optimized electrochemical reduction time is not explicitly stated in main text.
- Number of independent synthesis repeats and sample-to-sample standard deviations are not reported.
- Main performance graphs do not include error bars or statistical significance tests.
- Measurements were made in three-electrode laboratory cell with external potential applied.
- Unbiased tandem full cell or direct solar-to-hydrogen efficiency was not measured.
- Hydrogen and oxygen amounts were not quantified by gas chromatography.
- Faradaic efficiency and H2:O2 stoichiometry were not given.
- Electric field at tapered tip was not directly measured or quantitatively modeled.
- No controlled samples separate effects of tapered tip and mesoporosity.
- Al2O3 coating thickness was determined from selected HRTEM region; large-area thickness distribution not given.
- Operando change of oxygen-vacancy and Ti3+ species during reaction was not monitored.
- Mott-Schottky equation has internal notation issue regarding capacitance square and flat-band symbol.
- ECSA is indirect calculation based on assumed constant specific capacitance.
- Fifty-hour stability does not represent industrial operating lifetime.
- Long-term stability of triple-photoanode stack was not tested.
- Photocurrent and thickness homogeneity across 10 × 10 cm2 sample were not quantitatively measured.
- Although autoclave was eliminated, process requires 750 °C annealing.
- Acid use, furnace energy consumption, production-cycle duration and cost per unit area were not calculated.
- No economic analysis for FTO cost, platinum counter electrode and large-scale device components.
- Life-cycle impact and net energy payback time were not evaluated.
What study supports
- Rutile TiO2 nanorods can be grown on FTO using Petri-dish-based hydrothermal method.
- Method was applied to a 10 × 10 cm2 substrate.
- Produced nanorods show tapered-tip and mesoporous morphology.
- Approximately 2 nm amorphous Al2O3 layer can be applied to TiO2 surface.
- Al2O3 coating produced improvement consistent with surface charge separation and stability.
- Electrochemical reduction increased XPS signals related to oxygen vacancies and Ti3+.
- Combined treatment produced 2,35 mA cm-2 photocurrent at 1,23 VRHE.
- Surface charge separation efficiency reached %96,7.
- Reduced photoanode retained %96,8 of photocurrent after 50 hours.
- Triple parallel stack increased total photocurrent to 3,82 mA cm-2.
- Contribution of second and third layers shows diminishing returns due to light attenuation.
What study does not prove
- Commercial-scale economical hydrogen production has not been proven.
- It has not been shown that 10 × 10 cm2 photoanode has same photocurrent density as small sample.
- Continuous water splitting without external electrical bias has not been demonstrated.
- ABPE is not full-cell solar-to-hydrogen efficiency.
- It has not been confirmed by Faradaic measurement that all photocurrent goes to hydrogen and oxygen production.
- Independent contribution of tapered tips to performance increase has not been quantified.
- Independent contribution of mesopores was not measured with separate control electrode.
- It has not been independently verified that %96,7 surface efficiency is definitive world record across entire TiO2 photoanode literature.
- It has not been shown by comprehensive cost analysis that three layers are definite economic optimum.
- Outdoor durability over thousands of hours has not been established.
- Safety, emissions and waste management of large-scale acidic production process were not evaluated.
Meaning for energy and hydrogen technologies
Main technological contribution is an approach that removes physical size limitation of pressure autoclave in TiO2 nanorod photoanode production. This may allow larger flat-glass substrates to be processed in same solution.
Combined use of surface passivation and defect engineering improves charge arrival and utilization at surface rather than only increasing light absorption. Especially much larger increase in surface-separation efficiency than bulk-separation efficiency indicates interface losses are important in TiO2 photoanodes.
Parallel stacking shows light transmitted through upper photoanode can be reused in lower electrodes. However, declining layer contribution shows optical design, electrode spacing and light management will be decisive in future devices.
For technology to become industrial hydrogen system, large-area photocurrent mapping, gas efficiency, unbiased tandem cell, long-term outdoor testing, material and energy cost, acid recovery and production automation must be validated separately.
Усул ва натиҷаҳои таҳқиқот
Technical summary of production method
| Process | Applied condition |
|---|---|
| Substrate | TEC8 FTO glass, 6–9 Ω |
| Substrate cleaning | Ultrasonic cleaning in deionized water, ethanol and acetone |
| Hydrothermal solution | 30 mL water + 20 mL ethanol + 50 mL %36–38 HCl + 4,5 mL titanium butoxide |
| Growth vessel | Glass Petri dish; steel autoclave not used |
| Hydrothermal process | 100 °C, 4 hours |
| First annealing | 750 °C, 30 minutes |
| Al2O3 coating | Immersion in 5 mM Al(NO3)3 for 4 minutes |
| Second annealing | 200 °C in air, 1 hour |
| Electrochemical reduction | -0,5 V vs Ag/AgCl; 1 M KOH; scan of 0, 30, 60, 120 and 180 seconds |
Material characterization
| Technique | Instrument or condition | Property examined |
|---|---|---|
| SEM | ZEISS Sigma 360 | Nanorod surface and cross-sectional morphology |
| TEM/HRTEM/HAADF-STEM | JEOL JEM-F200 | Tip geometry, pores, lattice spacing and Al2O3 layer |
| EDS mapping | With HAADF-STEM | Distribution of Ti, O and Al |
| XRD | Cu Kα, λ = 1,54056 Å; 40 kV; 30 mA | Crystal phase and peak shifts |
| UV-vis | Shimadzu UV-2700 | Optical absorption and Tauc transition |
| XPS | Al Kα, 1486,6 eV | Oxygen vacancy, Ti3+/Ti4+ and Al chemical state |
Photoelectrochemical measurement conditions
| Measurement | Condition |
|---|---|
| Cell | Three-electrode; TiO2 working, Ag/AgCl reference, Pt counter electrode |
| Illuminated area | 1 cm2 |
| Electrolyte | 1 M NaOH |
| Light | AM 1.5G, 100 mW cm-2 |
| LSV | 0,1–1,8 VRHE; 20 mV s-1 |
| PEIS | 0,25 VRHE; 0,1 Hz–100 kHz; illuminated |
| Mott-Schottky | 0,1–0,8 VRHE; 1000 Hz; dark |
| IPCE | 300 W Xe lamp; AM 1.5G filter; 10 nm bandwidth; 1,23 VRHE |
| Charge separation | 1 M NaOH + 0,5 M Na2SO3 |
| Stability | 50 hours continuous illumination |
Main microstructural results
| Property | Reported result |
|---|---|
| Nanorod length | 400–600 nm |
| Nanorod diameter | 100–170 nm |
| Film thickness marked in cross section | Approximately 862 nm |
| Pore diameter | Mostly 5–35 nm; based on supporting figure |
| Al2O3 thickness | Approximately 2 nm |
| TiO2 lattice spacing | 0,313 nm; rutile (110) |
| Main crystal phase | Rutile TiO2 |
| Calculated optical transition | TiO2 approximately 3,01 eV; reduced sample approximately 2,89 eV |
Main performance results
| Metric | TiO2 | TiO2/Al2O3 | TiO2/Al2O3-ER |
|---|---|---|---|
| Jph, 1,23 VRHE | 1,72 mA cm-2 | 2,03 mA cm-2 | 2,35 mA cm-2 |
| Highest ABPE | %0,76 | %1,08 | %1,34 |
| ND | 1,03 × 1017 cm-3 | 1,73 × 1017 cm-3 | 1,84 × 1017 cm-3 |
| ΔOCP | 297 mV | 520 mV | 550 mV |
| IPCE, approximately 350 nm | Approximately %42 | Approximately %48 | Approximately %50 |
| Surface charge separation, 1,23 VRHE | %82,1 | %89,7 | %96,7 |
| Bulk charge separation, 1,23 VRHE | %21,8 | %23,5 | %25,3 |
| Cdl | 7,27 µF cm-2 | 7,86 µF cm-2 | 13,68 µF cm-2 |
| ECSA | 0,18 cm2 | 0,20 cm2 | 0,34 cm2 |
| Current retained after 50 hours | %79,8 | %89,5 | %96,8 |
Scale-up results
| Demonstration | Result | Interpretation limit |
|---|---|---|
| Large-area photoanode | 10 × 10 cm2 coated FTO produced | Performance not mapped across area |
| Single photoanode | 2,35 mA cm-2 | 1 cm2 test area and three-electrode cell |
| Two parallel photoanodes | 3,34 mA cm-2 | Second layer contributes 0,99 mA cm-2 |
| Three parallel photoanodes | 3,82 mA cm-2 | Third layer contributes 0,48 mA cm-2 |
| Gas formation | O2 and H2 bubbles shown visually | Quantitative gas amount and Faradaic efficiency not measured |
Technical conclusion
Experimental results show autoclave-free Petri-dish growth can produce high-photocurrent TiO2 nanorod photoanodes. Largest performance improvement is seen in surface separation efficiency. This supports central role of Al2O3 passivation and altered interfacial electronic structure after electrochemical reduction.
10 × 10 cm2 sample and triple stack demonstrate feasibility in production area and optical layering. However, claims of commercial scale require validation of large-area electrochemical performance, unbiased full cell, gas efficiency, long-term stability and production economics.
Ёддошт оид ба манбаъ ва усул
Full original title: Scalable Synthesis of Tip-Enhanced and Mesoporous TiO2 Nanorod Photoanodes for Efficient Solar Water Splitting
Authors and order: Yuanming Zhang; Yingrong Li; Ran Jing; Haoyun Lei; Jae Sung Lee; Hemin Zhang.
Equal-contribution authors: Yuanming Zhang and Yingrong Li. PDF states “These authors contributed equally to this work”.
Corresponding author: Hemin Zhang.
Corresponding-author email: hmzhang@scu.edu.cn
Institutional affiliations
- Yuanming Zhang, Yingrong Li, Ran Jing, Haoyun Lei and Hemin Zhang: College of Materials Science and Engineering, Sichuan University, Chengdu 610065, China.
- Hemin Zhang: Engineering Research Center of Alternative Energy Materials and Devices, Ministry of Education, Chengdu 610065, China.
- Jae Sung Lee: School of Energy and Chemical Engineering, Ulsan National Institute of Science and Technology, Ulsan 44919, South Korea.
Source type: Preprint research article including experimental nanomaterial production and photoelectrochemical characterization.
Research areas: Photoelectrochemical water splitting, TiO2 nanorods, hydrogen production, surface passivation, oxygen-vacancy engineering and large-area photoelectrode fabrication.
Page count: 37.
Publication platform: SSRN.
Upload date: 15 June 2026.
DOI: 10.2139/ssrn.6945787
Official link:SSRN study record
Peer-review status: Study has not undergone peer review. Pages of PDF contain warning “Preprint not peer reviewed”.
Peer-reviewed journal: As of 27 July 2026, no verified peer-reviewed journal version was found.
Original journal publisher: Cannot be determined because peer-reviewed journal publication is unverified. Current publication platform is SSRN.
Author contributions
PDF states Yuanming Zhang and Yingrong Li contributed equally. Beyond this, there is no CRediT statement separately listing conceptualization, experiments, analysis, software, visualization or writing roles.
Funding
Study was supported by National Natural Science Foundation of China grants 52572250 and 52276207.
Researchers also thank Suilin Liu from Analysis and Testing Center of Sichuan University for support with XPS analysis.
Conflict of interest
Authors declared no competing financial interests.
Data and supporting information
PDF states supporting information is available online. However, user-uploaded file does not include Figures S1–S16, detailed optimization plots, equivalent-circuit parameters or additional characterizations.
No open raw-data repository, production-protocol video or analysis-code link is provided in PDF.
Article preparation method
This Turkish Verianla article was prepared by examining title and author information, experimental section, equations, main-text tables, SEM/TEM/HRTEM images, elemental maps, XRD–UV-vis–XPS spectra, photoelectrochemical curves, charge-separation graphs, stability test, triple-stack results, 10 × 10 cm2 photoanode image, graphical abstract and references of uploaded 37-page preprint.
Scientific content is based only on uploaded study. External sources were used only to bibliographically verify title, author list, DOI, SSRN upload date and current publication status. No new experimental finding from outside PDF was added.
Main methodological limit
Strongest direct result of study is achievement of 2,35 mA cm-2 photocurrent, %96,7 surface charge separation and %96,8 current retention after 50 hours in a 1 cm2 illuminated laboratory photoanode.
10 × 10 cm2 production and 3,82 mA cm-2 triple-stack result support scale-up potential. However, large-area device efficiency, unbiased solar-hydrogen cell, quantitative gas production, long-term field durability, cost and environmental impact have not been validated.
This study is a preprint that has not undergone peer review. Findings show method is promising for large-area TiO2 photoanode production; they do not yet prove commercial or industrial water-splitting success.
Шарҳ гузоред
Нишонии почтаи электронии шумо нашр намешавад. Майдонҳои ҳатмӣ бо * нишон дода шудаанд