

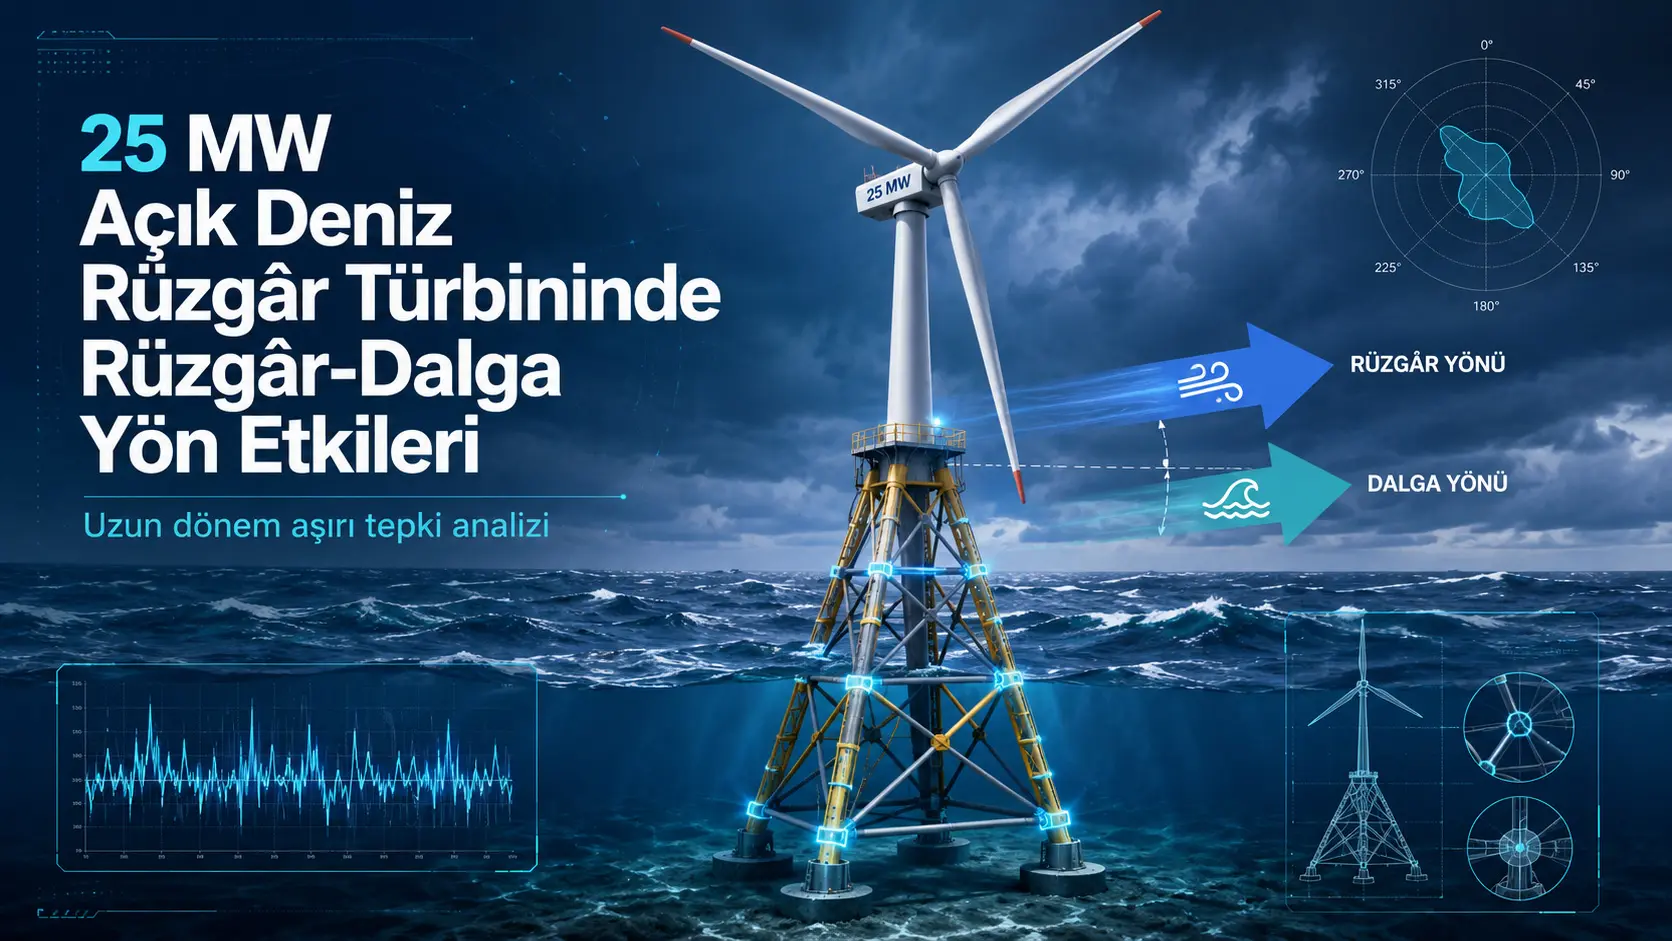
Тарҳрезии бехатари турбинаҳои бодии оффшорӣ танҳо аз муайян кардани баландтарин суръати бод ё бузургтарин мавҷ иборат нест. Самте, ки бод аз он меояд, оё мавҷ дақиқан бо бод ҳамсамт аст ё не, ва ин борҳо бо кадом кунҷ ба пояҳо ва диагоналҳои системаи борбари jacket таъсир мекунанд, низ метавонанд тақсимоти қувваҳои сохториро тағйир диҳанд. Ин таъсири самтӣ дар системаҳои jacket-и сепоя нисбат ба сохторҳои monopile-и буриши даврашакл ва тақрибан меҳварӣ-симметрӣ муҳимтар аст; зеро сахтӣ ва роҳҳои қувваи дохилии jacket дар ҳамаи самтҳо яксон нестанд.
Таҳқиқот response-и extreme load-и 50-year-и як offshore wind turbine-и 25 MW-class, ки бар three-legged jacket foundation такя мекунад, бо се different environmental-condition selection method муқоиса мекунад: traditional and aligned IFORM, D-IFORM, ки wind-wave misalignment-ро дар fixed wind direction ба назар мегирад, ва DiREC, ки ҳам absolute wind direction ва ҳам wind-wave misalignment-ро sector-by-sector ҳал мекунад.
Барои IFORM танҳо ду, барои D-IFORM даҳ ва барои DiREC 372 time-domain simulations анҷом дода шуданд. Aerodynamic loads бо OpenFAST 3.1 ва TurbSim тавлид шуда; jacket, wave, current ва foundation behavior дар Sesam модел карда шуданд. Ҳар load case пас аз хориҷ кардани first 20-second numerical transient, дар 10-minute analysis interval арзёбӣ шуд. Structural adequacy under NORSOK N-004 бо combined axial-force-bending checks-и tubular members ва local punching checks-и tubular joints баррасӣ шуд.
Highest member utilization factor дар IFORM 0,214, дар D-IFORM 0,211 ва дар DiREC 0,201 буд. Accordingly, DiREC highest utilization ratio on a single member-ро нисбат ба IFORM approximately %6,1 кам кард. Аммо ин decrease маънои онро надорад, ки directional resolution structure-ро overall less demanding кардааст. Дар DiREC results, high-utilization members a broader and flatter ranked envelope ташкил карданд; different direction and misalignment combinations multiple members-ро at closely similar critical levels қарор доданд.
Дар local tubular joints баръакс trend мушоҳида шуд. Highest joint utilization factor дар IFORM 0,170, дар D-IFORM 0,173 ва дар DiREC 0,197 ҳисоб шуд. DiREC value approximately %15,9 higher than IFORM аст. Ин result нишон медиҳад, ки вақте absolute wind direction ва wind-wave misalignment more finely resolved мешаванд, even if global structural response does not grow, local force transfer between brace and chord members метавонад more critical шавад.
Leading DiREC load cases махсусан дар 315° direction sector ҷамъ шуданд, while near-governing cases also occurred in 195° sector. Most critical joint case; under 315° wind direction, +20° wind-wave misalignment, 10,88 m significant wave height, 11,70 s peak period ва -8° yaw misalignment, at JT28 joint produced 0,197 utilization factor. Ин нишон медиҳад, ки highest structural demand does not always emerge in direction having largest wave height.
Global base shear and overturning moment decreased from IFORM to D-IFORM and DiREC. Highest base shear respectively 11,62 MN, 11,38 MN and 10,59 MN; highest overturning moment 388,85 MN·m, 380,01 MN·m and 356,61 MN·m were found. In contrast, local joint demand increased in DiREC. Therefore looking only at base shear or overturning moment can overlook how directional loads redistribute force paths inside jacket.
All reported utilization factors are clearly below limit 1,0. The investigated structure appears adequate for ultimate limit state in these analyses. Main contribution of study is not to identify an unsafe design; it is to show that more detailed directional environmental modeling can change governing member, governing joint and critical load direction.
Масъалаи асосии таҳқиқот чист?
Offshore wind turbines throughout their operating life are exposed to combination of wind, wave, current, turbulence, gravity and soil-foundation interaction. Ultimate limit state, namely ULS assessment, investigates whether structure loses load-carrying capacity under low-probability but high-severity environmental conditions.
Examining every hourly wind-wave state over decades of structural life with separate time-domain simulation creates extremely high computational cost. Environmental contour methods attempt to solve this by selecting limited set of critical metocean conditions representing a specified return period.
Basic assumption is that selected environmental states sufficiently envelope long-term extreme structural response. But this assumption becomes complex when structural response depends not only on scalar quantities such as wind speed and wave height but also on load direction.
Research question can be summarized as:
When wind and wave directions are represented in greater detail, how do the most critical members, tubular joints and global loads of a 25 MW-class three-legged jacket structure change?
Чаро 25 MW-class муҳим аст?
As rated power and rotor diameter of offshore wind turbines increase, aerodynamic loads, support-structure dimensions and structural load paths also change. Turbine used in study:
- Is in 25 MW rated-power class.
- Has 310 m rotor diameter.
- Hub height is 185 m.
- Uses 148 m-high tapered tower.
- Rotor-nacelle assembly mass is 1.556,81 tonnes.
- Transition-piece mass is 526 tonnes.
- Has cut-in wind speed 3 m/s, rated 10,87 m/s and cut-out 25 m/s.
It is not stated that this scale turbine is an actual commercial-site machine. Model is based on 25 MW reference-turbine design developed within CRC1463 project.
Чаро three-legged jacket ба direction sensitive аст?
Jacket systems are lattice structures composed of vertical or inclined main legs, braces connecting these legs, and tubular joints. Investigated jacket has:
- Three main legs,
- Three levels of X-bracing,
- Total jacket height 78,2 m,
- Three piles embedded approximately 65 m into soil,
- Piles with 4,3 m outer diameter and 40 mm wall thickness
.
Although three-legged arrangement is positioned at 120° intervals, it does not have continuous rotational symmetry. When environmental load direction changes:
- One leg can remain directly on load side.
- Two legs can carry load together.
- Specific braces can go into tension while others into compression.
- Brace-chord force combination in joints can change.
- Shares of horizontal force and moment transferred to piles can redistribute.
Therefore identical wind and wave magnitudes applied from different directions are not expected to produce same utilization factor.
Directional difference between monopile and jacket
Monopile is a single large-diameter cylindrical foundation and its global horizontal stiffness is in many cases less direction-sensitive. Wind-wave misalignment can affect global monopile response, but load-transfer geometry is not divided among as many individual members and joints as in jacket.
In jacket structure, direction change determines not only total base force but also through which brace, leg and tubular joint force passes. High directional sensitivity found in local joints is consistent with this geometric difference.
Environmental contour method чӣ мекунад?
Environmental contour defines combinations of wind, wave and other environmental variables corresponding to a specified return period. Aim is to select limited set of structurally meaningful conditions instead of simulating entire environmental time series.
Two-variable hierarchical conditional model is generally expressed as:
\[ f_{X,Y}(x,y)=f_X(x)\,f_{Y|X}(y|x) \]
where:
- fX(x): Marginal probability density of first environmental variable,
- fY|X(y|x): Conditional density of second variable given first,
- fX,Y(x,y): Joint density.
Copula-based alternative representation is:
\[ f_{X,Y}(x,y)=f_X(x)f_Y(y)c\left(F_X(x),F_Y(y)\right) \]
. Copula function aims to separate marginal distributions from dependence structure among variables. However, in high-dimensional problems with limited tail data, choice of copula family creates additional model uncertainty.
Special problem of circular variables
Wind and wave directions are not linear variables. 0° and 360° represent same direction. Therefore directly applying ordinary linear distributions to directional data can cause boundary-region problems.
In literature section of study, directional distribution is represented with mixture of von Mises components as:
\[ f_{\theta}(\theta)=\sum_{i=1}^{n}\omega_i f_i(\theta) \]
\[ f_i(\theta)= \frac{\exp\left[\kappa_i\cos(\theta-\mu_i)\right]} {2\pi I_0(\kappa_i)} \]
- ωi: Weight of mixture component,
- μi: Mean direction,
- κi: Concentration parameter showing how tightly directions cluster around mean,
- I0: Modified Bessel function of first kind, order zero.
These relations are not main distribution directly used in DiREC calculation; they are presented to explain theoretical background of directional environmental contour methods.
IFORM approach
Inverse First-Order Reliability Method transforms environmental variables into standard normal probability space and generates contour corresponding to specified reliability or return period. Method is widely used in offshore standards.
IFORM application in this study is a very simple design case:
- Absolute wind direction fixed at 0°.
- Wave direction assumed fully aligned with wind direction.
- 50-year mean wind speed at 10 m height set to 50 m/s.
- 50-year significant wave height is 12,53 m.
- Maximum wave height given as 23,31 m.
- Peak period is 12,54 s.
- Two simulations performed for yaw misalignment values -8° and +8°.
IFORM is used as aligned and fixed-direction baseline comparison method.
D-IFORM approach
Direct IFORM is a model-independent approach aiming to identify extremes by projecting normalized observations onto different direction vectors without constructing explicit multivariate joint distribution.
Normalized multidimensional observation vector Y is projected onto unit direction vector u as:
\[ R_u=u\cdot Y \]
. Projected sample in each direction becomes univariate extreme-value problem. Method description states these tail values can be estimated using peaks-over-threshold approach and generalized Pareto distribution.
In applied D-IFORM load cases:
- Absolute wind direction again fixed at 0°.
- Wind-wave misalignments selected as 0°, ±30° and ±90°.
- For each misalignment -8° and +8° yaw cases used.
- Total ten simulations performed.
| Absolute wind-wave misalignment | Significant wave height | Peak period |
|---|---|---|
| 0° | 12,44 m | 12,50 s |
| ±30° | 10,51 m | 11,49 s |
| ±90° | 5,75 m | 8,50 s |
As magnitude of misalignment angle increased, selected wave height and peak period decreased. Yet +30° and -30°, despite identical environmental magnitudes, need not produce same structural result because they act on jacket geometry from different directions.
DiREC approach
Directionally Resolved Environmental Contour is sector-based method developed by study authors. DiREC resolves both absolute wind direction and wave misalignment relative to wind separately.
Main steps are:
- Wind and wave records paired in 3-hour blocks.
- In each block mean significant wave height and circular mean wave direction are paired with highest hourly wind speed and its direction.
- First directional filter applied relative to center of specified wind sector.
- Simultaneously observed waves filtered again according to targeted wind-wave misalignment.
- Univariate extreme-value distribution built for each sector and misalignment interval.
- 50-year significant wave height and associated peak period obtained.
- These values combined with sector's 50-year wind speed and transferred to structural simulation.
Directional range used in DiREC
According to empirical distribution in study, approximately %60 of simultaneous wind-wave events remain within ±30° misalignment. At high wind speeds distribution concentrates more around small misalignment angles, whereas at low wind speeds remote swell broadens distribution.
Therefore DiREC analysis was conducted in:
\[ -30^\circ\leq\varphi\leq+30^\circ,\qquad \Delta\varphi=2^\circ \]
range.
- φ: Deviation of wave direction relative to wind direction,
- Δφ: 2° directional increment.
Absolute wind-sector centers considered are 195°, 225°, 255°, 285°, 315° and 345°. These represent 180°-360° geographic region where strongest wind and wave conditions at site are concentrated.
Two-stage directional filter
In first stage, simultaneous states within ±15° of each wind-sector center were selected. In second stage, separate wave-sector filter applied around target wave direction.
For example, when wind-sector center is 195° and target misalignment +2°, target wave direction is:
\[ \theta_W=195^\circ+2^\circ=197^\circ \]
. Among events passing first filter, waves around 197° are selected to form sample for this misalignment state.
Why wave-sector width matters
Study tested half-widths ±5°, ±10° and ±15° for wave direction. Very narrow ±5° filter:
- Left fewer than 20 observations in some misalignment ranges.
- Produced unstable and discontinuous directional curves.
- Made reliable estimation of extreme-value parameters difficult.
±10° and ±15° results were closer and smoother. Researchers selected ±10° half-width because it preserved directional resolution as much as possible while providing sufficient sample count.
At least 20 independent observations were required for each directional sample; intervals below this count were excluded.
Three-parameter Weibull model
Sector-based 50-year values in DiREC were estimated with three-parameter Weibull distribution:
\[ F(h)= \begin{cases} 0, & h<\gamma \\ 1-\exp\left[-\left(\dfrac{h-\gamma}{\alpha}\right)^\beta\right], & h\geq\gamma \end{cases} \]
- h: Significant wave height,
- α: Scale parameter,
- β: Shape parameter,
- γ: Location parameter.
Parameters estimated by maximum likelihood; distribution inverted using non-exceedance probability corresponding to daily maximum statistic to obtain 50-year return value.
At this stage wind and wave extremes were evaluated as separate marginal variables. DiREC does not construct a joint multivariate distribution for wind and wave.
Basic DiREC environmental conditions by sector
| Wind sector | 50-year wind speed | Hs, φ=-30° | Hs, φ=0° | Hs, φ=+30° |
|---|---|---|---|---|
| 195° | 27,69 m/s | 4,29 m | 9,22 m | 7,70 m |
| 225° | 28,01 m/s | 8,28 m | 11,17 m | 8,27 m |
| 255° | 27,15 m/s | 8,87 m | 10,67 m | 8,28 m |
| 285° | 27,38 m/s | 8,17 m | 10,43 m | 9,66 m |
| 315° | 25,67 m/s | 8,63 m | 9,83 m | 9,03 m |
| 345° | 23,32 m/s | 7,30 m | 9,18 m | 5,71 m |
Table also shows sector-conditioned wind speeds in DiREC are clearly lower than unconditional 50 m/s value in IFORM. Part of lower global loads in DiREC is related to this different environmental characterization.
Did highest wave always occur at exact alignment?
No. 2°-resolution tables in Appendix A show highest sector-conditioned wave height occurred outside φ=0° in most sectors:
| Wind sector | Highest Hs,50 in sector | Misalignment angle of this value |
|---|---|---|
| 195° | 10,55 m | +20° |
| 225° | 12,29 m | -16° |
| 255° | 10,96 m | +6° |
| 285° | 11,12 m | +22° |
| 315° | 11,18 m | +12° |
| 345° | 10,82 m | -12° |
These values show highest wave conditions can form plateau over roughly ±10°-15° and in some sectors broader small-misalignment region rather than narrow “exact alignment point”.
However, 225° sector with highest wave did not produce highest structural utilization factor. Structural demand depends on wave magnitude together with jacket orientation, wind direction, wave direction, yaw sign and local load path.
Site and metocean data basis
Turbine assumed located in German North Sea. Site conditions:
- 48,2 m water depth,
- 0,266 m/s normal current at mean sea level,
- 1,35 m/s extreme current at mean sea level,
- 100 mm marine growth between -2 m and 40 m,
- 50 mm marine growth in deeper regions,
- 1.325 kg/m³ marine-growth density,
- 1.025 kg/m³ seawater density
.
Environmental records were taken from CoastDat-2 reanalysis/hindcast dataset and supported with FINO-1 research-platform measurements. Text refers to 68-year observation period in directional-distribution assessment.
Soil model
FINO-1 soil profile represented with 18 layers. Layers consist mostly of sand varying from loose to very dense, with sand-silt mixture at some depths.
Depending on layer:
- Submerged unit weight 7,5–11 kN/m³,
- Internal friction angle 15°–45°
.
Pile-soil interaction modeled with:
- p-y for lateral behavior,
- t-z for axial friction,
- q-z for pile tip
relationships.
Because soil behavior is nonlinear, equivalent stiffness matrices linearized at representative load levels were created and applied as springs at pile heads. Matrices include not only linear translational stiffnesses but also cross terms between translation and rotation components.
Site orientation of jacket
Jacket oriented with one leg facing dominant north-northwest wave direction at site. Other two legs remain on leeward side.
This choice was justified by prior design studies indicating orientation with two legs simultaneously on load side could create higher demand in rear leg, and having single leg face wave could reduce required pile embedment and total pile mass.
Calculation of aerodynamic loads
Aerodynamic load time series on rotor, nacelle and tower were generated using OpenFAST 3.1. Turbulent wind fields created in TurbSim with Kaimal spectrum.
In extreme turbulent wind state consistent with IEC design framework:
\[ \psi_{\mathrm{yaw}}=\pm8^\circ \]
yaw misalignments considered.
Force and moment time series from OpenFAST transferred as external loads to Sesam jacket model at tower-transition-piece interface node.
Hydrodynamic loads
Wave and current loads calculated in Sesam with Morison equation. Irregular wave field represented by JONSWAP spectrum.
Hydrodynamic calculation considered together:
- Wave kinematics,
- Current,
- Diameter and mass effect of marine growth,
- Added-mass effect of internal water in flooded members,
- Soil and pile-head flexibility
.
How to understand “fully coupled” analysis
Study describes workflow as fully coupled aero-hydro-servo-elastic assessment. Method description states aerodynamic loads produced in OpenFAST are transferred to Sesam jacket model; hydrodynamic and foundation loads solved in Sesam.
PDF does not describe in detail a bidirectional iterative software coupling in which Sesam jacket deformations are sent back to OpenFAST rotor model within same time step. Therefore, in reproducing method, it would be useful to document whether “fully coupled” means one-way load transfer between software or includes additional feedback mechanism.
Time-domain simulations
For each simulation first 20 seconds removed to suppress numerical startup transients. Then 10-minute steady segment evaluated.
Number of load cases by method:
| Method | Directional representation | Number of simulations |
|---|---|---|
| IFORM | 0° fixed direction, aligned wind and wave, two yaw signs | 2 |
| D-IFORM | 0° fixed wind; 0°, ±30°, ±90° wave misalignment; two yaw signs | 10 |
| DiREC | Six absolute wind sectors; -30° to +30° in 2° steps; two yaw signs | 372 |
This comparison contrasts not only different probabilistic methods but also substantially different directional sampling densities. Study states this explicitly.
Ultimate limit state and utilization factor
Structural-code checks performed according to NORSOK N-004. Utilization factor interpreted as:
- UF < 1,0: adequate,
- UF = 1,0: design resistance reached,
- UF > 1,0: inadequate
.
UF of 0,20 does not mean member operates at only “%20 stress” in every sense. Utilization factor is code ratio combining axial force, bending, buckling and relevant design resistances in interaction equation.
Tension and biaxial bending check
For tubular members under tension, interaction given in PDF is:
\[ UF_t= \left(\frac{N_{Sd,t}}{N_{t,Rd}}\right)^{1{,}75} + \frac{\sqrt{M_{y,Sd}^2+M_{z,Sd}^2}}{M_{Rd}} \leq1{,}0 \]
- NSd,t: Design tensile force,
- Nt,Rd: Design tensile resistance,
- My,Sd, Mz,Sd: Design bending moments about local axes,
- MRd: Design bending resistance.
Compression, buckling and biaxial bending check
For members in compression, larger of two complementary checks taken as governing:
\[ UF_c=\max(UF_{c,1},UF_{c,2})\leq1{,}0 \]
\[ UF_{c,1}= \frac{N_{Sd,c}}{N_{c,Rd}} + \frac{1}{M_{Rd}} \left[ \left( \frac{C_{my}M_{y,Sd}} {1-N_{Sd,c}/N_{Ey}} \right)^2 + \left( \frac{C_{mz}M_{z,Sd}} {1-N_{Sd,c}/N_{Ez}} \right)^2 \right]^{1/2} \leq1{,}0 \]
\[ UF_{c,2}= \frac{N_{Sd,c}}{N_{cl,Rd}} + \frac{\sqrt{M_{y,Sd}^2+M_{z,Sd}^2}} {M_{Rd}} \leq1{,}0 \]
- NSd,c: Design compression force,
- Nc,Rd: Overall compression resistance,
- Ncl,Rd: Local buckling resistance,
- NEy, NEz: Euler buckling forces about two local axes,
- Cmy, Cmz: Reduction factors depending on moment distribution and boundary conditions.
Tubular-joint punching check
Joint utilization relation given for local transfer of brace forces into chord tube is:
\[ UF_{\mathrm{joint}}= \frac{N_{Sd}}{N_{Rd}} + \left(\frac{M_{y,Sd}}{M_{y,Rd}}\right)^2 + \frac{M_{z,Sd}}{M_{z,Rd}} \leq1{,}0 \]
.
Equation 12 is printed this way in PDF: ratio for y moment is squared, while square sign is not visible for z moment ratio. Formula has not been silently changed in this explanation. Researchers wishing to reproduce NORSOK implementation should compare this notation with original relation in relevant standard.
Results of member checks
| Method | Highest member UF | Member and position | Wind direction | Wind-wave misalignment | Yaw |
|---|---|---|---|---|---|
| IFORM | 0,214 | BM39, Stub_1 | 0° | 0° | -8° |
| D-IFORM | 0,211 | BM39, Stub_1 | 0° | 0° | -8° |
| DiREC | 0,201 | BM39, Stub_1 | 315° | -18° | -8° |
IFORM and D-IFORM produced same governing member and location. Nonzero misalignments in D-IFORM changed second- and lower-ranked member checks but did not change absolute maximum.
Maximum member utilization in DiREC is:
- Approximately %6,1 lower than IFORM,
- Approximately %4,7 lower than D-IFORM
.
In contrast, first ten member results in DiREC remained closer to one another. Ranked-utilization curve in Figure 10(a) decreases more gradually for DiREC. This means there are many directionally different near-governing states rather than one overwhelmingly governing state.
Near-governing member states in DiREC
| Member UF | Member/location | Wind direction | Misalignment | Hs,50 |
|---|---|---|---|---|
| 0,201 | BM39, Stub_1 | 315° | -18° | 10,67 m |
| 0,198 | BM42, Stub_1 | 315° | +14° | 11,07 m |
| 0,193 | BM26, Stub_2 | 225° | -12° | 11,93 m |
| 0,193 | BM25, Stub_1 | 285° | +18° | 11,01 m |
| 0,192 | BM51, Stub_2 | 195° | +20° | 10,55 m |
Distribution of first five results across four different wind sectors shows critical member demand cannot be explained only by highest-wave sector.
Results of tubular-joint checks
| Method | Highest joint UF | Joint | Brace / Chord | Wind direction | Misalignment |
|---|---|---|---|---|---|
| IFORM | 0,170 | JT23 | BM51 / BM50 | 0° | 0° |
| D-IFORM | 0,173 | JT27 | BM26 / BM25 | 0° | -30° |
| DiREC | 0,197 | JT28 | BM42 / BM39 | 315° | +20° |
D-IFORM increased highest joint UF by approximately %1,8 relative to IFORM and changed governing joint. Even though absolute wind direction remained fixed, -30° wave misalignment made brace-chord force transfer critical at a different joint.
DiREC joint utilization 0,197 is:
- Approximately %15,9 higher than IFORM,
- Approximately %13,9 higher than D-IFORM
.
Leading joint states in DiREC
| Joint UF | Joint | Wind direction | Misalignment | Hs,50 | Yaw |
|---|---|---|---|---|---|
| 0,197 | JT28 | 315° | +20° | 10,88 m | -8° |
| 0,190 | JT23 | 195° | +20° | 10,55 m | -8° |
| 0,172 | JT24 | 315° | +12° | 11,18 m | -8° |
| 0,159 | JT25 | 195° | +14° | 10,48 m | -8° |
| 0,149 | JT27 | 195° | +14° | 10,48 m | -8° |
In Figure 10(b), DiREC curve remains above IFORM and D-IFORM curves for much of ranking. Thus directional detail not only raised single maximum joint value but also broadened envelope of near-governing local joints.
Why joints are more sensitive than members
Member utilization factor shows relation of axial force and bending along element to that member's capacity. Joint check depends on local transfer of forces and moments from brace into chord wall.
When direction changes, even if total force in jacket remains similar:
- Braces carrying tension and compression can swap.
- Entry angle of brace force into chord can change.
- In-plane and out-of-plane bending components can redistribute.
- Local punching demand at particular tubular joint can grow.
Increase in local joint utilization while global loads decrease in DiREC is explained by this load-path mechanism.
Effect of yaw sign
All governing member cases were associated with -8° yaw misalignment. Most leading DiREC joint cases also occurred with -8° yaw sign.
Although +8° and -8° have same absolute misalignment magnitude, structural response is not symmetric. Possible reasons interpreted are:
- Direction of rotor aerodynamic thrust,
- Rotor and nacelle geometry,
- Nonlinear force transfer between tower and jacket,
- Phase and directional combination of wave and aerodynamic loads,
- Lack of continuous rotational symmetry in three-legged jacket
.
Global base shear
Resultant of horizontal reactions at mudline calculated as:
\[ V(t)=\sqrt{F_x(t)^2+F_y(t)^2} \]
where:
- Fx(t), Fy(t): Time-varying horizontal reaction components,
- V(t): Instantaneous base shear.
Overturning moment
Resultant of moments about two horizontal axes calculated as:
\[ M_{OT}(t)=\sqrt{M_x(t)^2+M_y(t)^2} \]
.
| Method | Highest base shear | Highest overturning moment | Governing direction/misalignment |
|---|---|---|---|
| IFORM | 11,62 MN | 388,85 MN·m | 0° / 0° |
| D-IFORM | 11,38 MN | 380,01 MN·m | 0° / 0° |
| DiREC | 10,59 MN | 356,61 MN·m | 315° / +12° |
Based on table values:
- D-IFORM base shear is approximately %2,1 lower than IFORM.
- DiREC base shear is approximately %8,9 lower than IFORM.
- D-IFORM overturning moment is approximately %2,3 lower than IFORM.
- DiREC overturning moment is approximately %8,3 lower than IFORM.
These percentages are comparisons calculated from table values.
Important limit of DiREC global-response result
For IFORM and D-IFORM, global time series evaluated across all load cases. For DiREC, global response time series extracted for structurally highest-ranked subset in ULS checks.
Therefore values 10,59 MN and 356,61 MN·m should be interpreted not as absolute global maxima across all 372 DiREC load cases, but as maxima of structurally selected governing subset.
Shape of time series
Figure 15 shows high-response interval of base shear. IFORM, D-IFORM and DiREC curves have:
- Similar peak times,
- Similar fluctuation pattern,
- Comparable frequency content
.
IFORM and D-IFORM largely overlap, while DiREC shows slightly lower amplitude at most peaks. Study concludes method selection in this example changes peak magnitude and local force distribution more than fundamental dynamic character of global time series.
Detailed interpretation of figures
Figure 1: D-IFORM projection logic
Normalized two-dimensional observations are projected onto direction vectors at different angles. Same observation receives different projection distance depending on vector direction. Thus states extreme in a particular environmental-variable combination stand out in one-dimensional tail sample.
Figure 2: DiREC algorithm
Two polar plots show how wave height and wind speed simultaneous with wave are selected within directional sectors. Distribution plots below show fitting univariate extreme-value distribution to sector samples and obtaining 50-year values.
Figure 3: 25 MW turbine and jacket geometry
Schematic shows 148 m tower, 78,2 m jacket and 65 m pile embedment together. Wind load acts on rotor-tower region, wave and current loads on submerged jacket members.
Figure 4: Jacket orientation
Plan view of three legs shows one leg placed facing dominant wave direction. Locations Leg 1, Leg 2 and Leg 3 provide geometric reference for later directional-response results.
Figure 5: Wind-wave misalignment distribution
Histogram has highest frequency at small misalignment angles. As wind speed increases, distribution concentrates more around 0°. Inset map shows North Sea site location.
Figure 6: Effect of sector half-width
Six polar plots compare ±5°, ±10° and ±15° filter results. ±5° curves are more irregular and partially discontinuous. Because ±10° and ±15° curves are largely similar, ±10° selected for balance between resolution and data quantity.
Figure 7: Coupled load environment
Left section shows aerodynamic and gravity loads on rotor and tower, right section wave, current, gravity and pile-head springs on jacket. Red interface node is location where OpenFAST loads transferred into Sesam model.
Figure 8: Soil-pile linearization
Nonlinear soil-response curve represented by slope of equivalent line around representative load level. Resulting linear springs applied at three pile heads.
Figure 9: Member identifiers
Positions of many jacket elements from BM3 to BM57 are marked relative to water level and seabed. Governing members such as BM39, BM42, BM26 and BM51 lie on different faces and bracing systems of jacket.
Figure 10: Ranked utilization factors
In member plot, DiREC is lower at first rank but stays above or close to IFORM and D-IFORM at subsequent ranks. In joint plot, DiREC forms highest curve through most ranks. These plots clearly show difference between “single maximum” and “broad critical envelope.”
Figure 11: Joint identifiers
Tubular joints JT5–JT30 marked along jacket height. Governing JT28, JT23 and JT27 are connected to different legs and bracing systems.
Figure 12: Comparison of member and joint maxima
From IFORM to DiREC blue member bar decreases while orange joint bar rises. Graph summarizes opposite effects of directional resolution on global member maximum and local joint maximum.
Figure 13: Polar distribution of critical states
Angular axis shows absolute wind direction, radial axis utilization factor, color wind-wave misalignment. Points are not evenly distributed in all directions; they cluster especially around 315° and 195°.
Figure 14: Global loads
Base-shear and overturning-moment bars decrease in order IFORM, D-IFORM, DiREC. Viewed alone this graph may suggest DiREC produces lower demand, but it should be interpreted together with local-joint increase in Figure 12.
Figure 15: Base-shear time history
Distinct peaks occur at approximately same times for all three methods. DiREC curve has slightly lower peak amplitude, while overall temporal shape of signal is similar.
Strengths of study
- Large 25 MW-class three-legged jacket system lacking continuous rotational symmetry was investigated.
- IFORM, D-IFORM and DiREC compared on same turbine and support model.
- Absolute wind direction and wind-wave misalignment treated as separate variables.
- DiREC scanned -30° to +30° at 2° resolution.
- Six different absolute wind sectors used.
- Directional distribution evaluated on 68-year metocean data basis.
- Effect of wave-sector width on sample count and curve smoothness compared.
- Minimum 20 independent observations condition applied.
- Aerodynamic, hydrodynamic, marine-growth and foundation-flexibility effects considered in same analysis chain.
- Not only global base loads but also member- and joint-level code checks performed.
- 372 DiREC load cases provided broad directional-response envelope.
- Negative and positive yaw signs simulated separately.
- Opposite trends of member maximum and joint maximum shown explicitly.
- Appendix provides wave-height and peak-period values at 2° increments for all sectors.
Limitations of study
- Study is preprint not peer reviewed.
- Results apply to one 25 MW reference turbine and one three-legged jacket geometry.
- Only a specific German North Sea site evaluated.
- Analysis limited to 50-year return period and DLC 6.1 ultimate-limit-state condition.
- Normal operation, fault states outside parked condition and other design load cases not examined.
- Fatigue damage or long-term cycle accumulation not calculated.
- Actual occurrence probabilities of DiREC sectors not included as weights in final structural ranking.
- DiREC does not build joint multivariate tail distribution for wind and wave.
- Only six wind sectors between 180°-360° included in structural DiREC analysis.
- DiREC misalignment limited to ±30°; rarer larger misalignments not included in structural scan.
- Some directional intervals excluded due to insufficient sample in narrow sectors.
- Superiority of three-parameter Weibull model over other extreme-value distributions not compared using comprehensive model-selection metrics.
- Confidence intervals for distribution parameters and 50-year return values not reported.
- Propagation of metocean-data and model uncertainty into structural UF results not provided.
- Because IFORM, D-IFORM and DiREC contain very different numbers of load cases, method effect and sampling-density effect cannot be fully separated.
- No statistical distribution across multiple independent turbulence or wave seeds reported for each load case.
- Soil behavior is nonlinear; linearized at representative load levels in time-domain analysis.
- No probabilistic sensitivity analysis for pile-soil parameter uncertainty.
- Structural model not validated against measured response data of an actual 25 MW site turbine.
- Bidirectional dynamic feedback between OpenFAST and Sesam not documented in detail.
- DiREC global base loads extracted not from all 372 cases but from structurally high-ranked subset.
- All utilization factors are around 0,20 or below; a lighter or capacity-near optimized jacket may show different directional sensitivity.
- Equation 12 contains asymmetric notation in exponent display of moment terms.
- Author-specific CRediT contribution statement, conflict-of-interest and open-data-access statement are not provided in PDF.
What study supports
- In three-legged jacket structures, absolute load direction can change ranking of critical members and joints.
- Wind-wave misalignment can change local force transfer even at same absolute wind direction.
- IFORM and D-IFORM produced similar governing member maximum in this example.
- D-IFORM reordered secondary critical members and governing joint due to nonzero misalignments.
- DiREC produced lower single member maximum but broader near-governing member envelope.
- DiREC raised local tubular-joint demand by approximately %15,9 relative to IFORM.
- Most critical DiREC states concentrated in 315° and 195° sectors.
- Largest structural demand did not always coincide with highest sector-conditioned wave height.
- -8° yaw sign produced more critical member cases than equal-magnitude +8°.
- Global base loads can decrease with directional detail while local joint loads increase.
- Assessment based only on base shear and overturning moment can miss local directional effects.
- Simplified methods may provide one value for global preliminary design, while directionally detailed methods provide different value for local-joint verification.
What study does not prove
- It has not been proven that DiREC always produces higher joint demand in all offshore structures.
- It has not been shown that IFORM is safe or overly conservative in all jacket designs.
- 0,197 utilization factor cannot be generalized to all 25 MW jackets.
- It has not been shown 315° direction governs other sites or jacket geometries.
- It has not been proven -8° yaw is always more critical than +8° for all turbines.
- It cannot be concluded highest wave height is structurally unimportant.
- It has not been shown DiREC replaces full long-term reliability analysis.
- Because sector probabilities are not used, DiREC ranking cannot be interpreted directly as total failure probability.
- Measured safety of structure under real-sea 50-year conditions has not been verified.
- Study provides no direct result on fatigue life or damage accumulation.
- Lower DiREC base shear does not mean entire structure is safer.
- Lower member maximum does not show local joints face lower demand.
- Study does not calculate economically optimal jacket orientation or minimum steel weight.
Possible implication for offshore-wind design
Study suggests simplified and detailed environmental methods may be used complementarily at preliminary and detailed design stages.
Simplified IFORM and D-IFORM cases may provide conservative envelope for:
- Global base shear,
- Overturning moment,
- Initial foundation sizing,
- Rapid design comparison
.
High-direction-resolution methods such as DiREC may be more informative for:
- Identifying critical tubular joints,
- Evaluating brace-chord force paths,
- Locating local thickening or can/stub regions,
- Optimizing jacket orientation,
- Adding near-critical load cases to design set
.
Future work should include sector occurrence probabilities in structural ranking, examine different load cases and operating conditions, test method on other jacket geometries, and extend directional effect to fatigue damage.
Усул ва натиҷаҳои таҳқиқот
Technical summary of research design
| Component | Method or value used in study |
|---|---|
| Structure | 25 MW, three-bladed, upwind offshore wind turbine |
| Rotor diameter | 310 m |
| Hub height | 185 m |
| Tower height | 148 m |
| Support structure | Three-legged jacket with three X-bracing levels |
| Jacket height | 78,2 m |
| Piles | Three; 4,3 m diameter; 40 mm wall thickness; approximately 65 m embedment |
| Site | German North Sea |
| Water depth | 48,2 m |
| Environmental return period | 50 years |
| Design condition | DLC 6.1, ULS |
| Metocean data basis | CoastDat-2, ERA5-referenced environmental data and FINO-1 site information |
| Time matching | 3-hour blocks |
| Aerodynamic software | OpenFAST 3.1 |
| Turbulence | TurbSim, Kaimal model |
| Structure and hydrodynamics | DNV Sesam |
| Wave spectrum | JONSWAP |
| Hydrodynamic force | Morison equation |
| Foundation model | Linearized pile-head stiffness matrices based on p-y, t-z and q-z |
| Simulation duration | 10 minutes after removing 20 s run-in |
| Yaw misalignment | -8° and +8° |
| Structural standard | NORSOK N-004 |
Technical comparison of environmental methods
| Feature | IFORM | D-IFORM | DiREC |
|---|---|---|---|
| Absolute wind direction | 0° | 0° | 195°, 225°, 255°, 285°, 315°, 345° |
| Wind-wave misalignment | 0° | 0°, ±30°, ±90° | -30° to +30°, 2° step |
| Sector probability | Not applied | Not applied | Not explicitly included as weight in final ranking |
| Distribution approach | Traditional environmental contour | Projection-based model-independent contour | Univariate extreme-value analysis within sectors |
| DiREC distribution | - | - | Three-parameter Weibull, MLE |
| Number of simulations | 2 | 10 | 372 |
Summary of member and joint results
| Method | Maximum member UF | Maximum joint UF | Member orientation | Joint orientation |
|---|---|---|---|---|
| IFORM | 0,214 | 0,170 | 0°, aligned, -8° yaw | 0°, aligned, -8° yaw |
| D-IFORM | 0,211 | 0,173 | 0°, aligned, -8° yaw | 0°, -30° misalignment, -8° yaw |
| DiREC | 0,201 | 0,197 | 315°, -18° misalignment, -8° yaw | 315°, +20° misalignment, -8° yaw |
Summary of global results
| Method | Yaw | Wind direction | Misalignment | Base shear | Overturning moment |
|---|---|---|---|---|---|
| IFORM | -8° | 0° | 0° | 11,62 MN | 388,85 MN·m |
| IFORM | +8° | 0° | 0° | 11,61 MN | 388,69 MN·m |
| D-IFORM | -8° | 0° | 0° | 11,38 MN | 380,01 MN·m |
| D-IFORM | +8° | 0° | 0° | 11,38 MN | 379,86 MN·m |
| DiREC | -8° | 315° | +12° | 10,59 MN | 356,61 MN·m |
| DiREC | +8° | 315° | +12° | 10,59 MN | 356,54 MN·m |
Core technical finding
Directional resolution did not change all response metrics in same direction:
- Global base loads: Decreased in DiREC.
- Highest member utilization: Slightly decreased in DiREC.
- Near-governing member envelope: Broadened in DiREC.
- Local joint utilization: Increased clearly in DiREC.
- Location of critical elements: Reordered according to direction and misalignment combination.
Therefore value obtained from directional analysis is not merely larger or smaller total load. Main contribution is identifying where load is transferred through jacket and which joints may govern design.
Safety interpretation
All reported member and joint utilization factors are below 1,0 limit. Even highest value 0,214 is far from capacity limit. Structure passes NORSOK ULS checks under investigated model and load cases.
However, low utilization factors do not mean directional method is unimportant. In a lighter or capacity-near optimized jacket, same percentage redistribution could change design decision or need for local thickening.
Ёддошт оид ба манбаъ ва усул
Full original title: Long-Term Extreme Response Analysis of 25 MW Offshore Wind Turbine Considering Wind-Wave Directional Effects
Authors and order: Mastaneh Moattari; Boso Schmidt; Chen Zhu; Elyas Ghafoori.
Equal contribution or co-first authorship: No equal-contribution or co-first-authorship statement in PDF.
Corresponding author: Mastaneh Moattari.
Corresponding-author email: moattari@stahl.uni-hannover.de
Other author emails given in PDF: B.Schmidt@ibmb.tu-bs.de; C.Zhu@ibmb.tu-bs.de; ghafoori@stahl.uni-hannover.de
Institutional affiliations
- Mastaneh Moattari and Elyas Ghafoori: Leibniz University Hannover, Institute for Steel Construction, ForWind, Hannover, Germany.
- Boso Schmidt and Chen Zhu: Technical University of Braunschweig, Institute of Building Materials, Concrete Construction and Fire Safety, Braunschweig, Germany.
Source type: Preprint research article including numerical structural analysis, extreme-value statistics and environmental-contour comparison.
Research areas: Offshore wind turbines, jacket support structures, environmental contours, wind-wave directional misalignment, structural reliability, ultimate limit state and tubular joints.
Page count: 37.
Publication platform: SSRN.
SSRN posting date: 15 June 2026.
DOI: 10.2139/ssrn.6945781
Official link:SSRN study record
DOI link:DOI record
Peer-review status: Study has not undergone peer review. Every page of PDF contains warning “Preprint not peer reviewed”.
Journal status: A record associated with same title on SSRN states study was submitted to Marine Structures journal. However, completion of peer review, acceptance or journal publication has not been verified.
Verified peer-reviewed journal information: No volume, issue, article number or official peer-reviewed publication date for current version.
Original journal publisher: Since peer-reviewed journal publication not verified, it is not determined for current version. Current publication platform of scientific text is SSRN.
Funding and acknowledgments
Study supported by German Research Foundation Deutsche Forschungsgemeinschaft under Collaborative Research Center CRC 1463, “Integrated Design and Operation Methodology for Offshore Megastructures”, project number 434502799.
Researchers also used central computing cluster operated by Leibniz University IT Services. Funding record for cluster is INST 187/742-1 FUGG.
Author contributions
PDF contains no CRediT contribution statement individually identifying conceptualization, software, data processing, structural modeling, analysis, visualization or writing tasks of authors. Therefore individual author roles have not been inferred.
Conflict of interest
Uploaded PDF contains no explicit conflict-of-interest statement. Absence of statement has not been interpreted as independent verification that no conflict exists.
Data and code access
PDF describes CoastDat-2, ERA5, FINO-1, CRC1463 design data, OpenFAST, TurbSim and Sesam sources. However, it provides no open repository link for study-specific processed directional dataset, MATLAB DiREC code, Sesam model, OpenFAST input files or full time series of 372 simulations.
Article preparation method
This Turkish Verianla article was prepared by examining title and author information, abstract, introduction, environmental-contour theory, D-IFORM projection scheme, DiREC algorithm, three-parameter Weibull equation, 25 MW turbine and jacket geometry, site and soil tables, wind-wave misalignment histogram, polar plots of six direction sectors, OpenFAST–Sesam analysis scheme, soil linearization, NORSOK utilization equations, member and joint tables, ranked utilization curves, global-load graphs, conclusions, limitations and all sector tables in Appendix A of the uploaded 37-page preprint.
Scientific content is based only on methods, data and results presented in uploaded PDF. External sources were used only to bibliographically verify title, author order, institution, DOI, SSRN posting date, platform and current publication status. No new structural result or metocean finding from outside PDF was added.
Main methodological limit
Most important direct result of study is that more detailed directional environmental characterization does not uniformly increase global extreme loads; instead, it redistributes critical demand across different members, joints and directional states. DiREC reduced maximum member utilization while increasing maximum local joint utilization.
This result applies to a single 25 MW reference turbine and single three-legged jacket model. DiREC not directly including sector occurrence probabilities in structural ranking, global DiREC comparison relying only on selected high-ranked subset, and results not validated with experimental field measurements should be considered before generalization.
Study is preprint not peer reviewed. Findings indicate directional environmental analyses may be valuable particularly for local-joint design in next-generation jacket-supported turbines; they do not prove any particular design standard, environmental-contour method or jacket orientation is definitively superior in all projects.
Шарҳ гузоред
Нишонии почтаи электронии шумо нашр намешавад. Майдонҳои ҳатмӣ бо * нишон дода шудаанд