

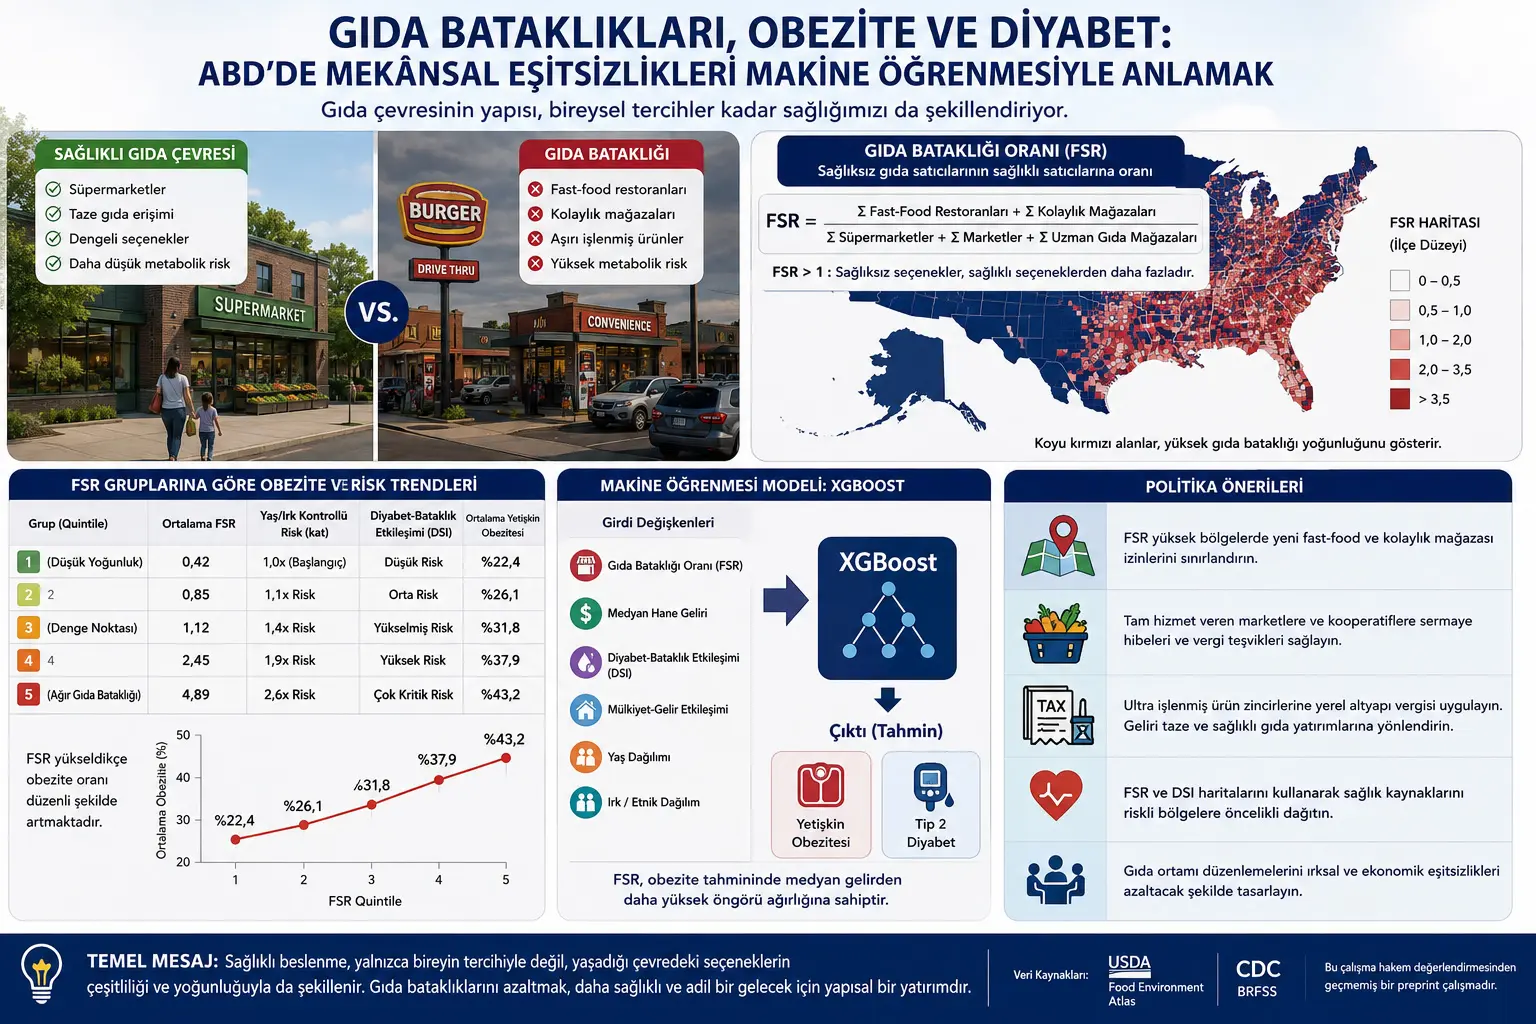
Чаро Фаҳмондани Obesity Танҳо Бо Individual Choice Нокифоя Буда Метавонад?
Public-health discussions оид ба obesity ва type 2 diabetes аксар вақт ба он тамаркуз мекунанд, ки individual чӣ мехӯрад, чӣ қадар exercise мекунад ва кадом lifestyle choices дорад.
Ин approach муҳим аст, аммо метавонад environment-еро, ки person дар он choice мекунад, дар background гузорад.
Агар neighborhood дорои fewer stores selling fresh vegetables, fruit and basic foods бошад, аммо fast-food restaurants, gas-station convenience stores ва outlets selling high-calorie ready products зиёд бошанд, healthy choice theoretically possible мемонад, вале дар daily life harder мешавад.
Аз ин рӯ, study obesity-ро танҳо дар framework of individual willpower ё lack of knowledge намебинад; онро also through spatial distribution of physical food infrastructure арзёбӣ мекунад.
Main argument-и author:
На танҳо мавҷудияти кадом food, балки commercial dominance-и кадом food option метавонад metabolic health outcomes-ро таъсир диҳад.
Difference Between Food Desert and Food Swamp
Study ду concept-ро равшан ҷудо мекунад.
| Concept | Main Focus |
|---|---|
| Food desert | Absolute absence or severe insufficiency of healthy and fresh food options |
| Food swamp | Unhealthy, energy-dense and ultra-processed options numerically overwhelm healthier alternatives |
Дар food desert main problem is absence of healthy option.
Дар food swamp healthy option may exist, but fast-food restaurants ва convenience stores may be so dense that consumer’s practical “choice environment” tilts toward unhealthy products.
This distinction matters. Opening one supermarket may not fully change structural balance if many more fast-food outlets surround it.
Кадом Data Sources Истифода Шуданд?
Study refers to two main public-data infrastructures:
- USDA Food Environment Atlas: Used for county-level food outlets, geographic access and vendor-density indicators.
- CDC Behavioral Risk Factor Surveillance System: Identified as source of localized adult-obesity and type 2 diabetes prevalence indicators.
Abstract also mentions CDC Branded Food Products Database. However methods do not clearly explain which variables from this database entered model.
This creates a clarity problem in data-source description.
Food Swamp Ratio Чӣ Гуна Ҳисоб Шуд?
Main engineered variable is Food Swamp Ratio.
\[ FSR_i = \frac{ \sum \text{Fast-food restoranları}_i + \sum \text{Kolaylık mağazaları}_i }{ \sum \text{Süpermarketler}_i + \sum \text{Marketler}_i + \sum \text{Uzmanlaşmış gıda mağazaları}_i } \]
Дар formula:
- \(FSR_i\), Food Swamp Ratio of geographic unit i,
- Numerator represents commercial density of unhealthy or energy-dense options,
- Denominator represents density of outlets offering broader and relatively healthier food options.
Study interprets areas with \(FSR > 1\) as environments where unhealthy commercial options numerically outnumber healthy alternatives.
High Ratio Чӣ Маъно Дорад?
Suppose an area has:
- 20 fast-food restaurants,
- 10 convenience stores,
- 5 supermarkets,
- 5 markets,
- 2 specialized food stores
.
Then:
\[ FSR = \frac{20+10}{5+5+2} = \frac{30}{12} = 2{,}5 \]
This describes commercial environment where unhealthy options are approximately 2,5 times as dense as healthier alternatives.
This example is not from study’s own data table; it is provided only to explain formula.
Ин Indicator Чиро Намеченад?
Food Swamp Ratio may be useful physical-environment indicator, but alone it does not measure:
- Actual nutrient content of foods sold,
- Food prices,
- Store opening hours,
- Public-transport connections,
- Online food ordering,
- Where consumers actually shop,
- Store size,
- Density of processed foods within a supermarket,
- Different product options within a fast-food restaurant.
In other words FSR measures numerical balance of physical outlets, not food actually consumed.
Чаро XGBoost Ба Ҷойи Linear Regression Истифода Шуд?
Author argues ordinary least squares linear-regression models may be limited in capturing complex and nonlinear relationships.
Outcomes such as obesity may not respond linearly to one variable.
For example food-swamp effect may differ:
- In low-income areas,
- In areas with high diabetes prevalence,
- By age distribution,
- In areas with high housing cost.
XGBoost is machine-learning method that sequentially combines many decision trees and attempts to reduce errors of previous trees.
This structure can model nonlinear thresholds and interactions among variables.
XGBoost Objective Function
Study gives general objective function as:
\[ Obj(\theta) = \sum_{i=1}^{n} L(y_i,\hat{y}_i) + \sum_{k=1}^{K} \Omega(f_k) \]
This equation balances two parts:
- Data fit: Error between observed and predicted values,
- Model complexity: Penalty preventing trees from growing excessively.
Tree-complexity penalty is defined as:
\[ \Omega(f) = \gamma T + \frac{1}{2} \lambda \sum_{j=1}^{T} w_j^2 \]
In formula:
- \(T\), number of terminal leaves in tree,
- \(\gamma\), penalty for adding new leaf,
- \(w_j\), weight of leaf j,
- \(\lambda\), regularization coefficient applied to magnitude of leaf weights.
If model only minimized training error, it could overfit. Complexity penalty is added to improve generalizability.
Кадом Variables Ба Model Дохил Шуданд?
Study highlights following variables:
| Variable | Role in Study |
|---|---|
| Food Swamp Ratio | Measure density of unhealthy vendors relative to healthy food vendors |
| Median Household Income | Represent regional economic condition |
| Diabetes-Swamp Interaction | Model combined effect of food swamp and existing diabetes burden |
| Property-Income Interaction | Represent structure among housing value, housing-cost burden and disposable income |
| Age and race adjustments | Account for demographic distribution and historical inequalities |
Diabetes-Swamp Interaction Vector
Defined interaction variable is:
\[ DSI_i = FSR_i \times \text{Diyabet yaygınlığı}_i \]
This aims to capture whether high food-swamp density adds structural burden in area already having high diabetes prevalence.
For example, among two counties with same FSR, county with higher diabetes prevalence will have higher DSI.
But there is an important methodological issue: if one target outcome is diabetes prevalence itself, using an interaction variable that contains diabetes prevalence may create target-leakage risk.
Document does not clearly state whether model target is obesity, diabetes, or separate models for both. Therefore technical use of DSI cannot be fully verified.
Property-Income Interaction Matrix
Study mentions another composite variable called Property-Income Interaction Matrix.
It is said to represent intersection of property values, housing-cost burden and liquid household income.
But mathematical formula is not provided.
Therefore document does not make clear:
- Which indicators compose it,
- How they are scaled,
- Whether it is product, ratio or index,
- How missing data were handled
.
Five-Level Geographic Grouping Чиро Нишон Медиҳад?
Table on page 5 divides geographic areas into five groups according to Food Swamp Ratio.
| Geographic Group | Mean FSR | Age/Race-Controlled Risk | Diabetes-Swamp Interaction | Mean Adult Obesity |
|---|---|---|---|---|
| 1. group: Low density | 0,42 | Baseline: 1,0-fold | Low risk | %22,4 |
| 2. group | 0,85 | 1,1-fold risk | Moderate risk | %26,1 |
| 3. group: Balance point | 1,12 | 1,4-fold risk | Elevated risk | %31,8 |
| 4. group | 2,45 | 1,9-fold risk | High risk | %37,9 |
| 5. group: Severe food swamp | 4,89 | 2,6-fold risk | Very critical risk | %43,2 |
Table shows adult obesity rises stepwise as FSR increases.
Absolute obesity difference between lowest and highest groups can be calculated:
\[ 43{,}2\% - 22{,}4\% = 20{,}8 \text{ yüzde puanı} \]
Ин тавр ҳисоб кардан мумкин аст.
This indicates strong graded association in table.
Оё Table Causality Нишон Медиҳад?
No.
Table shows food-swamp density and obesity vary together. But same areas may also differ in:
- Physical-activity opportunities,
- Public transportation,
- Healthcare access,
- Education level,
- Food prices,
- Working hours,
- Neighborhood safety,
- Residential segregation,
- Lifetime poverty,
- Local cultural consumption patterns.
Machine learning can adjust for some variables, but observational cross-sectional data cannot remove all confounding effects.
Оё FSR Аз Median Income Қавитар Аст?
Study claims Food Swamp Ratio carries higher predictive weight than median household income in model.
This suggests physical retail environment may not be explained only by personal income.
Even in high-income area, if fast-food and convenience stores are overwhelmingly dense, unhealthy commercial environment may carry substantial predictive weight for obesity.
However document does not provide:
- Feature importance scores,
- SHAP summary plot,
- Gain values,
- Numeric importance-ranking table
.
Therefore how much stronger FSR is than income cannot be independently evaluated.
SHAP Values Барои Чӣ Истифода Шуданд?
Study refers to SHAP interactions.
SHAP is explainable-AI method aiming to estimate how much each feature pushes a specific prediction upward or downward.
Globally it can examine:
- Which variables are generally more important,
- Which direction prediction changes as variable rises
.
Locally it can show which variables contributed to predicted obesity for a specific county.
However SHAP plots themselves are not provided. Therefore distributions of age, race, income and FSR effects cannot be visually verified.
Findings Related To Age
Study argues younger demographic groups living in high-FSR areas show faster rise toward obesity.
This is important claim because it suggests metabolic risk may accelerate through early exposure to structural food environment, not only advanced age.
However document does not provide:
- Age groups,
- Group sizes,
- Interaction coefficients,
- Confidence intervals,
- Age-specific SHAP curves
.
Therefore age-related result rests on narrative interpretation in text.
Racial Inequality Finding
Study argues high-density food swamps are disproportionately located in Black and Hispanic communities.
This is interpreted in relation to historical residential segregation, zoning decisions and commercial investment patterns.
Author describes physical infrastructure as one of foundational drivers of racial health inequality.
However document does not provide:
- FSR distribution by racial group,
- Effect size,
- Statistical test,
- Map,
- County- or population-weighted comparison
.
Therefore this claim lacks detailed quantitative support in presented version.
Midwest and South Regions
Study states FSR exceeded 3,5 in some Midwest and Southern counties.
Author links these clusters to historical industrial zoning and commercial-placement practices.
However which states or counties belong to these clusters is not specified.
Without map or county list, regional claim cannot be checked in detail.
Model Performance Чӣ Гуна Чен Карда Шуд?
Document states model was “optimized” and captured nonlinear relationships better than traditional linear models.
However following metrics are not presented:
- R-squared,
- Mean absolute error,
- Root mean square error,
- Training-test performance,
- Cross-validation result,
- Performance compared with OLS,
- Hyperparameter-search method,
- Feature selection.
This omission makes it difficult to evaluate actual predictive performance.
Risk of Overfitting
XGBoost is powerful but can overfit, especially with many features and interactions.
Overfitting means model learns training data extremely well but performs worse on new data.
Study explains regularization terms. However performance on independent test data or cross-validation is not presented.
Therefore generalizability is not directly demonstrated.
Risk of Ecological Fallacy
Study uses county or geographic-unit-level data.
This creates risk of interpreting regional association as individual association.
A county can have high FSR and high obesity prevalence, but it is unknown whether people with obesity actually shop at stores represented by that high FSR.
This is ecological fallacy.
Study does not use individual diet, shopping-location or personal health-record data.
Limitation of Cross-Sectional Data
Study relies on one period or combined cross-sectional public data.
Therefore following temporal order cannot be established:
- Did food-swamp density increase first?
- Did obesity and diabetes rise afterward?
- Or did certain food vendors move into areas because of high demand?
Stronger causal inference would require longitudinal analyses tracking store density and health outcomes together over years.
Policy Proposal: Using FSR in Zoning Decisions
Study recommends local authorities incorporate FSR into commercial-zoning decisions.
Author argues new fast-food and convenience-store permits could be temporarily paused in areas where FSR exceeds 1,5.
It also recommends floor-area rules requiring a certain share of commercial space to be allocated to fresh and whole-food distribution.
These proposals were not tested in research; they are policy recommendations derived from model findings.
Possible Effects of Limiting Fast-Food Permits
Limiting growth of new unhealthy-food vendors could theoretically shift commercial balance.
But before implementation, potential effects should be assessed:
- Burden on small businesses,
- Employment,
- Consumer prices,
- Commercial displacement to neighboring areas,
- Product content in existing businesses,
- Economic sustainability of healthy-food vendors.
Study did not model these secondary effects.
Subsidy and Tax Regulation
Author recommends that full-service grocery stores and cooperative food markets in high-FSR areas receive:
- Capital grants,
- Tax exemptions,
- Infrastructure support
.
It also proposes local infrastructure tax on chains selling ultra-processed and hyper-palatable products, with revenue redirected to fresh fruit and vegetable supply.
Approach aims not only to reduce unhealthy options but also support economic survival of healthy options.
Predictive Allocation of Health Resources
Study suggests public health systems such as Medicare and Medicaid could use FSR and DSI maps as early-risk detection tools.
In high-risk regions it proposes prepositioning:
- Nutrition programs,
- Diabetes and obesity screenings,
- Community-level clinical checkpoints,
- Preventive-health counseling,
- Local food-access projects.
Author argues this could shift from reactive disease treatment to proactive resource allocation.
Claim of Cost Reduction
Study argues intervention in physical food infrastructure could reduce federal healthcare spending long term.
However document provides no:
- Cost-effectiveness analysis,
- Budget-impact model,
- Number of cases prevented,
- Medicare or Medicaid savings estimate
.
Therefore cost reduction is a policy inference, not directly measured finding.
Ҷиҳатҳои Қавии Study
- Distinguishes food desert and food swamp concepts.
- Expresses density of unhealthy and healthy vendors in a single ratio.
- Aims to combine publicly available geographic and health data.
- Uses XGBoost for nonlinear relationships.
- Evaluates income, property, age and race in one framework.
- Uses interaction variables to focus on combined-risk patterns.
- Reports code and data-processing infrastructure as open source.
- Shifts attention from individual behavior to physical food infrastructure.
Маҳдудиятҳои Study
1. Not peer reviewed
Document explicitly states study has not undergone peer review.
2. Sample size not explained
Number of states, counties or geographic units included is not reported.
3. Data years unclear
Years of USDA and CDC data and how years were matched are not explained.
4. Model performance not provided
No R-squared, error metrics, cross-validation or test-set performance.
5. Hyperparameters not provided
Number of trees, learning rate, maximum depth and subsampling rates are absent.
6. SHAP outputs not shown
SHAP is mentioned but no plot or numerical table is provided.
7. Raw regional results absent
No county lists, maps or regional distributions shown.
8. Causality cannot be established
Machine learning detects predictive association; observational cross-sectional data do not demonstrate causal effect.
9. Ecological fallacy risk
County-level results do not directly represent individual shopping or health behavior.
10. FSR measures only number of stores
Store size, product price, quality and actual consumption are not accounted for.
11. DSI may have target-leakage risk
It is unclear whether diabetes prevalence is used both as outcome and component of predictor.
12. Some strong demographic claims lack numerical detail
Claims regarding young people, Black communities and Hispanic communities are not accompanied by detailed effect sizes.
13. No cost-effectiveness analysis
Claim of public-health spending savings is not demonstrated with economic model.
Research Чиро Намегӯяд?
Study does not show that fast-food restaurants certainly cause obesity in a specific individual.
It also does not prove every person living in high-FSR area eats unhealthily.
It cannot imply median income is unimportant or individual behaviors have no role.
Main claim is more limited:
Regional distribution of food vendors may be an important structural feature for spatial prediction of adult obesity.
Future Research Чӣ Бояд Кунад?
- Clearly report number of counties and population.
- Show data years and data-merging steps.
- Publish model hyperparameters.
- Compare OLS, random forest and XGBoost.
- Provide cross-validation and independent-test results.
- Publish SHAP summary and dependence plots.
- Provide county-level FSR map.
- Add food price, store size and public transportation variables.
- Combine regional indicators with individual shopping and consumption data.
- Track store changes and health outcomes longitudinally.
- Evaluate zoning/subsidy policies through natural experiments.
- Conduct cost-effectiveness analysis for food-swamp interventions.
Хулосаи Умумӣ
This preprint evaluates obesity and diabetes burden in United States not only through individual choices but spatial distribution of commercial food infrastructure.
Author’s Food Swamp Ratio measures density of fast-food restaurants and convenience stores relative to healthy-food vendors.
In presented five-level grouping table, as FSR rises from 0,42 to 4,89, mean adult obesity rises from %22,4 to %43,2.
XGBoost model is claimed to give FSR higher predictive weight than median household income. Study also argues food swamps create compounded risk in areas with high diabetes prevalence.
However document does not provide model performance, sample size, hyperparameters, SHAP plots or raw regional results.
Therefore study provides not causal evidence between food environment and metabolic disease, but a strong spatial predictive hypothesis worth further investigation.
Most important public-health message is that healthy eating may depend not only on what person chooses, but on which options are repeatedly and dominantly present where person lives.
Усул ва Натиҷаҳои Таҳқиқот
Research is cross-sectional spatial data analysis and machine-learning study combining publicly available USDA and CDC data.
Main independent variable is Food Swamp Ratio, calculated as ratio of unhealthy-food vendors to healthy-food vendors.
Adult obesity and type 2 diabetes prevalence were used as regional health outcomes.
Model reportedly also includes median household income, property-income interaction, diabetes-swamp interaction, age and race distribution variables.
XGBoost approach was used and model complexity controlled with regularized objective function.
| Key Finding | Result Presented in Study |
|---|---|
| Lowest FSR group | FSR 0,42; obesity %22,4 |
| Balance group | FSR 1,12; obesity %31,8 |
| Highest FSR group | FSR 4,89; obesity %43,2 |
| Predictive weight of FSR | Claimed to be higher than median household income |
| Diabetes interaction | High FSR and high diabetes burden said to create combined risk |
| Regional inequality | High-FSR clusters claimed in Midwest and South |
| Racial inequality | Black and Hispanic communities said to be disproportionately represented in high-FSR areas |
Study does not provide model error metrics, confidence intervals, cross-validation or comparative-model results.
Ёддошт оид ба Манбаъ ва Усул
Ин мақола бар study-и Amal Sanjay Jain бо унвони “Spatial Inequities in Food Environments: A Predictive Machine Learning Framework for Auditing Obesogenic Landscapes and Chronic Metabolic Health in the United States”, prepared on 21 April 2026, асос ёфтааст.
Document explicitly states “This preprint research paper has not been peer reviewed”. Study was presented on SSRN as preprint and has not undergone peer review.
Author states research was conducted independently and does not represent views of previous or current employers.
Data and code infrastructure are said to be published in a public GitHub repository.
Research uses publicly available, deidentified, regional and administrative data. It contains no individual health records, diet records or direct consumer behavior.
Study is machine-learning-based predictive analysis. Findings are associative and predictive, not causal.
Document lacks some critical details needed for methodological reproducibility: sample size, analysis years, missing-data handling, hyperparameters, model-validation metrics, SHAP outputs and comparative-model performance.
No individual causality, certain policy impact or cost-saving claims not demonstrated by study have been added. Policy proposals are presented as author’s recommendations derived from model findings, not direct experimental results.
Шарҳ гузоред
Нишонии почтаи электронии шумо нашр намешавад. Майдонҳои ҳатмӣ бо * нишон дода шудаанд