

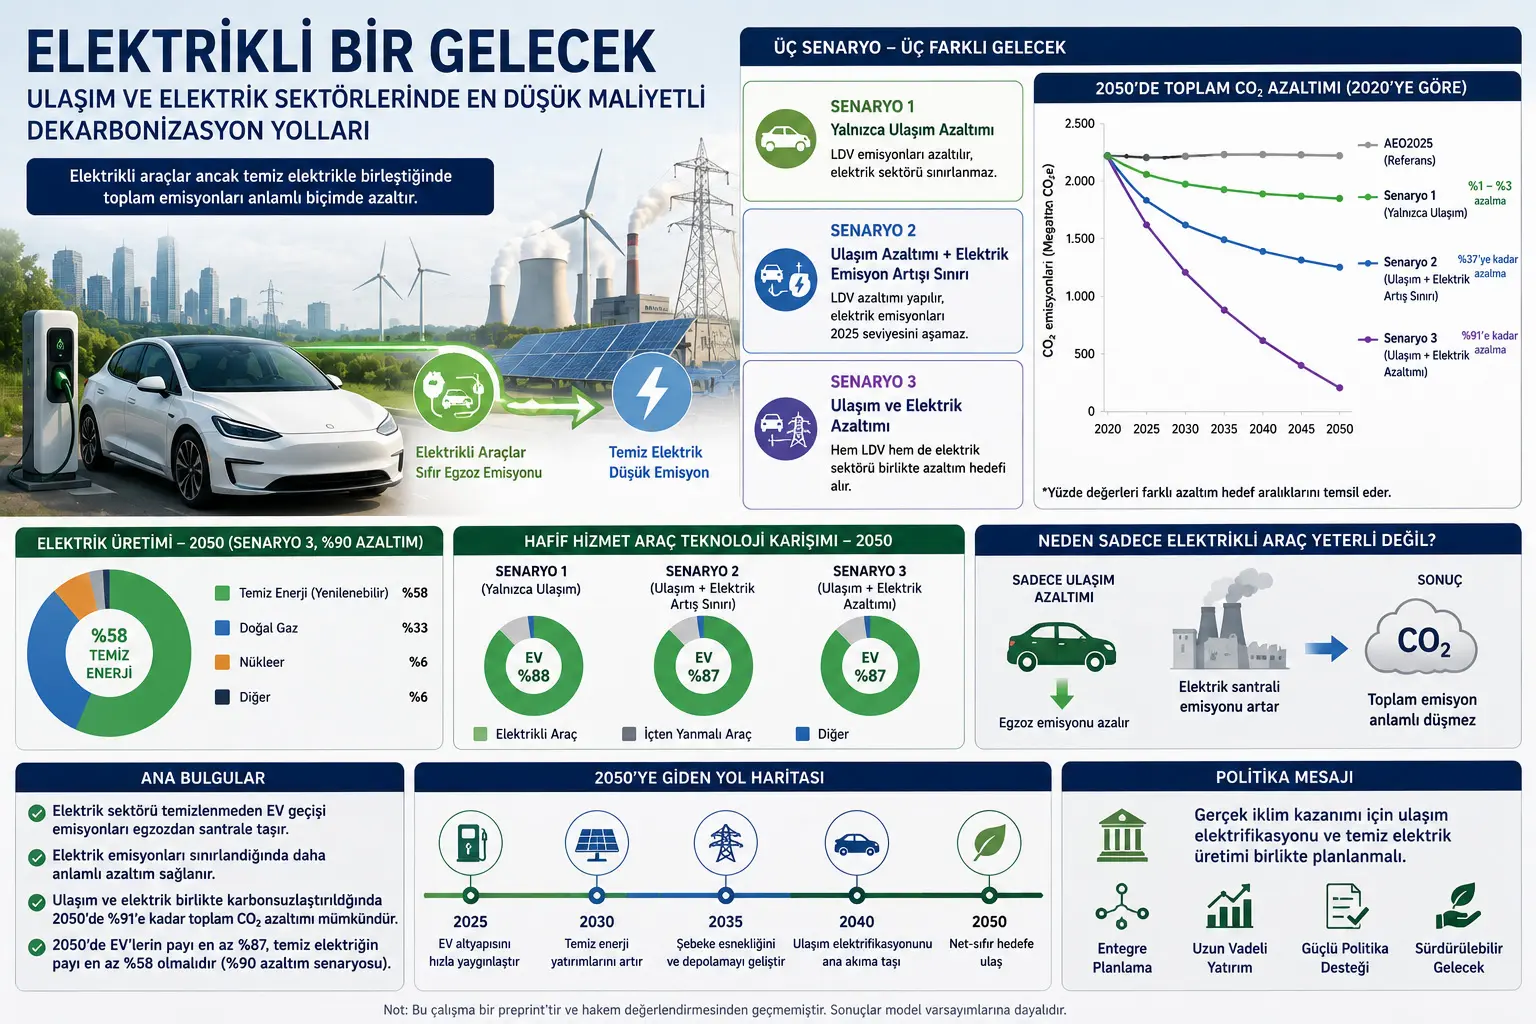
Мошинҳои барқӣ аксаран аз он сабаб, ки “бе ихроҷи ихроҷгоҳ” мебошанд, яке аз намоёнтарин рамзҳои нақлиёти тоза ҳисобида мешаванд. Дар ҳақиқат, мошинҳои барқӣ ҳангоми истифода аз қубури ихроҷ CO₂ хориҷ намекунанд. Аммо ин маънои онро надорад, ки энергияи истифодакардаи мошини барқӣ комилан zero-carbon аст. Агар electricity барои charging аз natural gas, coal ё дигар fossil sources истеҳсол шавад, emission танҳо аз exhaust pipe-и vehicle ба chimney-и power plant интиқол меёбад. Ин study маҳз ҳамин risk, яъне cross-sector emission shifting-ро меомӯзад.
Starting point-и research ин аст, ки transportation ва electricity generation дар US share-и хеле калони greenhouse-gas emissions доранд. Тибқи study, transportation sector тақрибан 28 фоизи greenhouse-gas emissions ва electricity generation тақрибан 25 фоизро ташкил медиҳад. Вақте ин ду sector якҷо дида мешаванд, онҳо дар маркази national decarbonization policy қарор мегиранд. Аммо онҳо independent нестанд. Electrifying transport electricity demand-ро зиёд мекунад. Агар electricity generation ҳамзамон clean нашавад, emissions reduction аз transportation метавонад бо increase in electricity-sector emissions қисман ё пурра баргардонида шавад.
Аз ҳамин сабаб study electric-vehicle transition-ро танҳо transportation policy намебинад, балки joint transformation-и transportation-electricity system мешуморад. Ин approach хеле муҳим аст. Дар society баъзан electric-vehicle transition ҳамчун масъалаи содаи “replace gasoline car with electric car” фаҳмида мешавад. Аммо дар system level савол мураккабтар аст: Бо зиёд шудани EV count charging demand чӣ қадар боло меравад? Ин demand-ро кадом power plants таъмин мекунанд? Natural gas зиёд мешавад ё clean energy? Агар electricity sector ҳамзамон carbon cap надошта бошад, total CO₂ emissions воқеан кам мешаванд?
Method-и study кӯшиш мекунад ин relationship-и complex-ро бо least-cost energy-system optimization арзёбӣ кунад. Model-и истифодашуда TIMES ном дорад. TIMES аз approach-и The Integrated MARKAL-EFOM System бармеояд ва linear-optimization-based model аст, ки ҳисоб мекунад energy systems дар зери technology, fuel, demand ва emission constraints чӣ гуна evolve мешаванд. Database-и study EPAUS9rT version 20.4 мебошад, ки US energy system-ро ба nine regions ҷудо мекунад. Model тавассути VEDA 2.0 interface ва GAMS optimization infrastructure run шудааст.
Мантиқи TIMES чунин аст: system energy demands муайян дорад; масалан total miles traveled by vehicles ё electricity demand. Барои meeting this demand technologies гуногун мавҷуданд: gasoline vehicles, diesel vehicles, electric vehicles, natural-gas power plants, clean-energy sources, nuclear generation ва other options. Model information-и investment cost, operating cost, efficiency, lifetime, fuel needs ва emissions output-и technologies-ро истифода мекунад. Сипас зери constraints муайян, масалан “light-duty vehicle CO₂ emissions by 2050 must fall by 90%”, technology mix-еро select мекунад, ки demand-ро бо lowest total system cost таъмин кунад.
Ин calculation logic дар маркази study аст. Detailed algebraic objective function дар paper дода нашудааст, аммо general logic-и TIMES-like least-cost optimization-ро бо following relation шарҳ додан мумкин аст:
\[ \min \sum_{t} \sum_{i} C_{i,t} \times X_{i,t} \]
Ин expression барои шарҳи logic-и model class истифода шудааст. Дар ин ҷо Ci,t cost-и technology i дар time t; Xi,t use ё investment level-и он technology мебошад. Objective total cost across periods and technologies-ро minimize кардан аст, while satisfying energy demand and emission constraints. Ин formula ҳамаи technical details-и study-ро replace намекунад; танҳо logic-и “find least-cost technology mix” –ро фаҳмо мекунад.
Emission-reduction targets-ро бо constraint type-и зерин фаҳмидан мумкин аст:
\[ CO2_{s,t} \leq Cap_{s,t} \]
Дар ин ҷо CO2s,t CO₂ emissions-и sector s дар year t; Caps,t allowed upper limit барои ҳамон sector мебошад. Масалан, вақте target-и 90% reduction for light-duty vehicles by 2050 гузошта мешавад, model маҷбур аст vehicle technologies and energy use-ро select кунад, то CO₂ emissions-и sector аз cap пасттар бимонад.
Scenario design-и study дар се main pathways сохта шудааст. сенарияи якум танҳо CO₂ emissions-и light-duty vehicles-ро reduce мекунад. Барои electricity generation additional emission cap вуҷуд надорад. Ин future-ро ифода мекунад, ки policy танҳо vehicle electrification-ро target мекунад ва electricity-sector emissions growth маҳдуд намешавад. Дар ин scenario model метавонад EVs-ро дар transportation зиёд кунад, аммо барои meeting new electricity demand метавонад least-cost fossil options мисли natural gas-ро expand кунад.
сенарияи дуюм талаб мекунад, ки ҳангоми transport electrification electricity-sector CO₂ emissions аз 2025 level зиёд нашаванд. Ин scenario ба idea-и “EVs can grow, but their growth should not create new CO₂ increases in electricity sector” мувофиқ аст. Бо ин роҳ emission shifting from transportation to electricity generation кӯшиш мешавад пешгирӣ шавад.
сенарияи сеюм most integrated approach мебошад. Дар он ҳам light-duty vehicles ва ҳам electricity generation simultaneous CO₂-reduction targets доранд. Яъне ҳам direct vehicle emissions кам мешаванд ва ҳам electricity system барои charging vehicles clean мешавад. Main result-и study ин аст, ки significant and deep total emissions reduction бештар бо ҳамин co-decarbonization strategy ба даст меояд.
Барои ҳар scenario reduction targets-и 10%, 20%, 30%, 40%, 50%, 60%, 70%, 80% ва 90% model шудаанд. Graphs махсусан examples-и 30%, 50%, 70% ва 90% reduction-ро нишон медиҳанд. Ин targets барои represent кардани particular policy document не, балки барои дидани system response under different emission constraints истифода шудаанд.
Figure 1 regional system-и US-ро дар model нишон медиҳад. EPAUS9rT database US-ро ба nine regions ҷудо мекунад: New England, Middle Atlantic, East North Central, West North Central, South Atlantic, East South Central, West South Central, Mountain ва Pacific. Ин regional disaggregation дар country-и калон ва energy-resource-diverse мисли US муҳим аст. Electricity-generation mix, demand growth, renewable potential ва vehicle-technology transition by region differ карда метавонанд. Model while producing national results uses this regional energy-system structure.
Results-и сенарияи якум most cautionary part-и study мебошанд. Light-duty-vehicle CO₂ emissions кам мешаванд, electricity generation бошад uncapped мемонад. EV share боло меравад ва direct vehicle emissions паст мешаванд. Аммо electricity demand rises, therefore electricity-generation emissions increase ё remain high. Study инро ҳамчун “emissions shift from tailpipe to smokestack” interpretation мекунад. Transportation sector cleaner менамояд, аммо expected decrease in total system emissions ба амал намеояд.
Figure 2 ин вазъро визуалӣ нишон медиҳад. Дар AEO25 reference projection, from 2020 to 2025, combined emissions аз 2.304,47 megaton CO₂e in 2020 to 2.116,53 in 2025 decrease мешавад. Аммо after 2025 combined emissions largely flat мемонанд. Дар model’s own base scenario emissions after 2020 about 12% fall, but rise again toward 2050 and in 2050 are only 0,41% below 2020. Дар сенарияи якум, even with reductions in LDV emissions, total combined emissions fall only 1%–3%; largest reduction occurs under 70% LDV CO₂ reduction projection.
Ин result барои EV policy warning-и қавӣ аст. Агар electricity generation clean нашавад, electrifying vehicle fleet may not significantly reduce total system emissions. In extreme cases electricity-generation CO₂ share of combined emissions can reach as high as 97%. Ин нишон медиҳад, ки climate benefit-и EVs directly depends on carbon intensity of grid.
Figure 3 нишон медиҳад, ки electricity generation by source in сенарияи якум чӣ гуна тағйир меёбад. Electricity demand increases across all projections. Дар AEO25 projection generation rises from 15.589 petajoule in 2020 to 24.985 petajoule in 2050, about 60% increase. Дар 90% LDV CO₂ reduction projection of сенарияи якум, electricity demand nearly doubles between 2020-2050. Аммо share of natural gas in electricity generation rises from 33% in 2020 to 59-60% in 2050. Clean-energy sources rise only from 19% in 2020 to 25% in 2050. Coal declines sharply after 2040, but growth in clean energy is not strong enough to meet new EV demand in low-carbon way.
Figure 4 shows light-duty vehicle miles by fuel type in сенарияи якум. In AEO25, gasoline vehicles remain major share for long time; EV share rises from about 1% of total miles in 2020 to 48% in 2050. In base scenario EVs begin to meet about half of demand by 2045 and reach 58% in 2050. As stricter LDV CO₂ reduction targets are imposed in сенарияи якум, EV share increases; in 2050 it ranges from at least 58% to as high as 88%. However, because electricity generation is not CO₂-capped, this increase is insufficient for deep total-system emissions reduction.
сенарияи дуюм offers more balanced intermediate approach. Here light-duty vehicles decarbonize while electricity-generation CO₂ emissions are not allowed to exceed their 2025 value. It is designed to prevent new electricity demand from EVs from producing uncontrolled fossil-generation growth. Study shows total emissions under this scenario are lower than AEO25 and base scenario. In the most aggressive 90% LDV CO₂ reduction projection, combined emissions by 2050 can fall by as much as 37% relative to 2020.
Figure 5 shows trajectories of CO₂e emissions from transport and electricity generation under сенарияи дуюм. LDV share decreases in more aggressive projections; by 2050 LDV CO₂ accounts for between 22% and 4% of combined emissions. This indicates EVs sharply reduce transport emissions. But because electricity generation is constrained at 2025 level, overall system emissions are better controlled than in сенарияи якум.
Figure 6 shows electricity-generation mix under сенарияи дуюм. Electricity demand rises with EV adoption. Under 90% LDV CO₂ reduction projection, electricity generation by 2050 can increase by as much as 83%, compared with 60% in AEO25. Natural gas remains dominant, peaking around 56% share near 2035 and then declining somewhat. Clean-energy sources rise from 19% in 2020 to 32-33% in 2050. Coal nearly exits system after 2035. This result shows electricity-sector emission cap forces greater clean-energy investment.
Figure 7 shows vehicle-technology mix in сенарияи дуюм. In AEO25 EVs meet 48% of demand in 2050; under 90% LDV CO₂ reduction EVs meet 87% of light-duty vehicle demand. Even in the most aggressive scenario internal-combustion vehicles still supply at least 8% of demand. Thus deep emission reduction requires EV dominance, but complete elimination of ICE vehicles is not an unavoidable model outcome.
сенарияи сеюм produces strongest decarbonization result. By 2050, both light-duty vehicles and electricity generation are subject to same CO₂ reduction targets. Figure 8 shows combined emissions can fall by 40% to 91% relative to 2020. In the most aggressive 90% reduction projection, combined emissions by 2050 fall very sharply. As study abstract notes, when both sectors are strongly co-decarbonized, combined CO₂ emissions in 2050 can be 91% below 2020.
Two conditions are especially important for this result. First, at least 87% of light-duty vehicle demand must be met by EVs. Second, at least 58% of national electricity generation must come from clean-energy sources. When these two conditions are met together, EV transition produces real system-level emissions reduction. Electrifying vehicles alone is insufficient; generation sources must also be cleaned rapidly.
Figure 9 shows how electricity-generation sources change in сенарияи сеюм. At reduction targets of 70% and above, electricity generation is higher than AEO25 and base scenario because transport electrification raises demand. By 2050, generation can be up to 75% above 2020. In most projections natural gas still supplies at least half of electricity in 2050. But in the 90% reduction projection natural-gas share peaks around 2030, then declines, and clean energy becomes the main source toward 2050. In this projection clean energy supplies 58% of electricity in 2050.
Figure 10 shows light-duty vehicle technology mix under сенарияи сеюм. EVs become dominant and meet at least half of vehicle demand. Even in the most aggressive projections internal-combustion vehicles do not completely disappear; they continue to meet at least 9% of travel demand. Discussion interprets this as transition buffer reflecting continued use of existing ICE vehicles and difficulty of solving all use cases with EVs at same pace.
Another striking finding is that diesel can overtake gasoline in some projections among remaining ICE vehicles. Authors attribute this to controlling only CO₂ emissions. Diesel vehicles can emit less CO₂ per mile than gasoline vehicles, so model may sometimes prefer diesel under cost and CO₂ constraints. This does not mean diesel is environmentally superior overall; study does not evaluate criteria pollutants, air-quality impacts or NOx/particulate emissions.
Cost assessment is also important. Table 3 shows difference in system cost per ton CO₂ compared with base scenario. In сенарияи якум, where only light vehicles decarbonize and electricity sector is unconstrained, deep LDV decarbonization can increase both total system costs and total system emissions. Authors regard this as economically and environmentally unattractive and counterintuitive: expensive EV investment occurs while added electricity demand is met with natural gas and total system emissions do not fall meaningfully.
сенарияи дуюм ва сенарияи сеюм show different picture. When electricity-sector emission growth is limited or electricity sector receives simultaneous reduction target, emission reductions occur in exchange for additional investment. Table 3 shows per-ton costs rise under more aggressive targets, reflecting greater investment required for deeper decarbonization. Study suggests medium 50-70% reduction ranges may represent more balanced policy strategies before shifting attention to other emission sources such as heavy-duty transport or commercial sector.
Daily-life implication is straightforward. When a person buys an EV, tailpipe emissions disappear. But if electricity charging that car still comes heavily from natural gas or coal, climate benefit is limited. Thus real transformation depends not only on individual vehicle choice but on how clean the electricity grid is, how charging infrastructure is planned and whether energy and transport policies are coordinated.
For energy and transport policy, study shows limitations of single-sector policies. EV incentives or vehicle emission standards alone may not deeply reduce total emissions if electricity generation remains fossil-heavy. Similarly, clean-energy investment alone may not sufficiently reduce transport emissions if vehicle fleet does not transform. Main message is that transport electrification and clean electricity generation must be planned together.
From past, present and future perspective, study describes three-stage transition. Historically transport and electricity were treated as separate policy areas: transport through vehicle fleet, fuel economy and oil consumption; electricity through power-plant mix and grid planning. Today EV growth connects these sectors. In future successful decarbonization will require vehicles, charging infrastructure, electricity generation and clean-energy investment to be evaluated within one system model.
Strength of study is modeling EV climate impact jointly with electricity generation, rather than in isolation. This tests simple assumption that “more EVs means lower emissions” and shows it is not always true. Study also links to current US energy outlook using AEO25 data and incorporates regional energy-system structure through EPAUS9rT database.
Limitations remain. First, focus is only relationship between light-duty vehicles and electricity generation. Major changes in heavy-duty transport, aviation, freight, industry, residential and commercial electricity demand are not central. Second, TIMES assumes perfect foresight: model acts as if future technology costs, demand and policy constraints are known in advance. Real-world investors face uncertainty, supply-chain problems, policy risk, consumer behavior, infrastructure delays and financing constraints. Third, criteria pollutants and health effects are not assessed, so a technology that appears favorable for CO₂ may need separate air-quality evaluation.
What study says and does not say should be clear. It does not say EVs are unnecessary; on the contrary, deep reductions require very high EV share. But it emphasizes EV climate benefits emerge together with electricity-generation decarbonization. It does not claim exact technology mix in 2050; it examines least-cost pathways under specific model assumptions and emission constraints. Because study is non-peer-reviewed preprint, findings should be interpreted carefully and alongside other models, updated cost data, policy developments and real-world evidence.
Усул ва Натиҷаҳои Таҳқиқот
Study барои таҳлили он ки чӣ гуна light-duty vehicles ва electricity-generation sectors дар US то соли 2050 зери different CO₂-reduction targets transform шуда метавонанд, TIMES techno-economic optimization model-ро истифода кардааст. Model technologies ва fuels-ро барои meeting energy demand бо lowest cost интихоб мекунад ва emission constraints-ро ҳам account мекунад.
Дар modeling infrastructure following elements истифода шудаанд:
- Model: TIMES energy-system optimization model.
- Database: Version 20.4 of EPAUS9rT database developed by EPA.
- Regional structure: EPAUS9rT system dividing US into nine regions.
- Comparison source: Energy Information Administration Annual Energy Outlook 2025 (AEO25).
- Model-running infrastructure: VEDA 2.0 and GAMS.
- Analyzed outputs: CO₂ emissions, electricity-generation sources, vehicle-technology mix, electricity generation, vehicle-mile demand and cost/emission comparisons.
Study се main scenarios model кардааст:
| Scenario | Light-duty vehicle CO₂ constraint | Electricity-generation CO₂ constraint | Policy logic |
|---|---|---|---|
| Scenario 1 | 10-90% reduction targets by 2050 | No constraint | Transport electrification occurs, electricity-sector emissions not separately controlled. |
| Scenario 2 | 10-90% reduction targets by 2050 | Electricity-generation CO₂ emissions cannot exceed 2025 value. | Transport electrification while preventing electricity-sector emission growth. |
| Scenario 3 | 10-90% reduction targets by 2050 | Same 10-90% reduction targets by 2050 | Transport and electricity generation decarbonize together. |
Light-duty vehicles in model are separated by fuel type: gasoline, diesel, electricity, hydrogen, compressed natural gas, ethanol and liquefied petroleum gas. Vehicle classes include mini compact, compact, full size, crossover, pickup, van, small SUV and large SUV. Study assumes most light-vehicle technologies have 13-year lifetime and EVs 15-year lifetime.
On electricity side natural gas, coal, clean energy, nuclear and other sources are included. Study excludes new nuclear plant construction; existing plants are assumed to continue operating while economically available. Authors note that if more nuclear generation were added before 2050, emissions reduction could be easier.
Main findings of Scenario 1:
| Finding | Numerical value / direction | Meaning |
|---|---|---|
| AEO25 combined-emissions change | Decline from 2.304,47 to 2.116,53 megaton CO₂e between 2020 and 2025 | About 8% decline, followed by largely flat trend |
| Base-scenario 2050 emissions | Only 0,41% below 2020 | Current least-cost pathway does not achieve deep decarbonization. |
| Scenario 1 total emission reduction | Only 1-3% decline under high LDV-reduction targets | Transport emissions fall, but electricity-sector emissions limit total reduction. |
| Electricity-sector share | Can reach up to 97% of combined emissions in 2050 in some projections. | Emission burden shifts from transport tailpipes to electricity generation. |
| Clean-energy share | Rises from 19% in 2020 to about 25% in 2050. | Clean-energy growth is insufficient to support EV demand climate benefit. |
Most important result of Scenario 1 is that EV expansion without constraining electricity-sector CO₂ does not significantly reduce total-system emissions. Model meets rising electricity demand using natural gas, one of least-cost sources. Thus declining transport CO₂ is offset by increasing or persistent electricity-generation CO₂.
Main findings of Scenario 2:
| Finding | Numerical value / direction | Meaning |
|---|---|---|
| Total emission reduction | Up to 37% decline relative to 2020 under 90% LDV reduction projection | EV transition becomes more effective when electricity-sector emission growth is constrained. |
| Increase in electricity generation | Up to 83% by 2050 under 90% LDV reduction projection | EVs substantially increase grid demand. |
| Clean-energy share | Rises from 19% in 2020 to 32-33% in 2050. | Electricity-emission cap forces more clean-energy investment. |
| EV share | EVs meet 87% of demand in 2050 under 90% LDV reduction projection. | EVs must become dominant technology for deep transport reduction. |
| Residual ICE vehicle share | At least 8% of demand remains with ICE vehicles even under strongest reduction. | Complete zero-ICE fleet is not a necessary model outcome. |
Scenario 2 shows that electricity-generation emission growth must at least be halted for EV transition to produce meaningful emissions reduction. This scenario does not fully decarbonize electricity sector; it limits emissions to 2025 level and thereby restricts emission shifting.
Main findings of Scenario 3:
| Finding | Numerical value / direction | Meaning |
|---|---|---|
| Combined CO₂ reduction | 40% to 91% decline relative to 2020 | Deepest reduction occurs when both sectors transform together. |
| Most aggressive projection | 91% combined-emissions reduction by 2050 | Deep decline possible with simultaneous transport and electricity decarbonization. |
| EV requirement | At least 87% of LDV demand must be met by EVs. | EVs are main transport technology for deep reduction. |
| Clean-electricity requirement | At least 58% of national electricity must come from clean energy. | EV climate benefit depends on clean grid. |
| Role of natural gas | In most projections still supplies at least half of electricity in 2050; under 90% reduction clean energy becomes dominant. | Natural-gas infrastructure remains in some scenarios, but clean energy becomes main source for deepest reduction. |
Cost/emission assessment is summarized in Table 3. The table gives ratio of system-cost difference to total-system CO₂-emissions difference relative to base scenario. Values are presented as 2005 US dollars / CO₂ ton.
| Projection | 2005 US dollars / CO₂ ton | Interpretation |
|---|---|---|
| LDV Only 10% Reduction | $0,00 | Same least-cost solution as base scenario. |
| LDV Only 30% Reduction | $0,00 | Additional policy effect does not diverge from base. |
| LDV Only 50% Reduction | + $199,68 | Transport-only decarbonization becomes problematic in cost and emissions terms. |
| LDV Only 70% Reduction | + $195,55 | System effect remains weak because electricity sector is unconstrained. |
| LDV Only 90% Reduction | + $262,94 | Deep EV transition without clean electricity is not economically or environmentally attractive. |
| LDV + Steady ELC 90% Reduction | - $164,32 | Reduction becomes more meaningful when electricity-emission growth is prevented. |
| LDV & ELC 90% Reduction | - $106,40 | High emission reduction achieved when both sectors decarbonize together. |
Signs in table should be interpreted carefully according to study discussion. Дар сенарияи якум positive values represent situation where deep LDV decarbonization without electricity-sector limit raises costs and fails to deliver desired total-emission decline. Дар сенарияи дуюм ва сенарияи сеюм emission reduction occurs with additional investment. Higher per-ton costs under more aggressive targets reflect more system transformation required for deeper decarbonization.
Limitations of study are:
- Model focuses on relationship between light-duty vehicles and electricity generation; heavy-duty transport, freight, aviation and other sectors are not main analysis.
- Major structural changes in residential, commercial and industrial electricity demand are not separately modeled as main focus.
- TIMES assumes perfect foresight; real-world uncertainty, investment risk, supply-chain bottlenecks and consumer behavior are not fully represented.
- Policy changes, fuel-economy standards, incentives, tariffs and energy-investment plans can change over time.
- Study focuses on CO₂ emissions; criteria air pollutants and health effects are not analyzed.
- Results depend on model assumptions, EPAUS9rT database and AEO25 comparison framework.
Overall, study shows limited effect of single-sector decarbonization and importance of integrated two-sector planning. EVs are necessary for deep reduction, but not sufficient. What makes EVs truly low-carbon is electricity from clean sources.
Ёддошт оид ба Манбаъ ва Усул
Ин мақола дар асоси таҳқиқоти Arahim Zuniga, Ivonne Santiago ва Kristen Brown бо унвони “Electrifying the Future: Least-Cost Decarbonization Pathways in the Transportation and Electricity Sectors” таҳия шудааст. Institutional affiliations are University of Texas at El Paso and University of Texas at San Antonio.
Study addresses CO₂-reduction pathways to 2050 in US light-duty vehicle and electricity-generation sectors, EV transition, clean-energy generation, cross-sector emission shifting and least-cost technology optimization. TIMES model, EPAUS9rT database, VEDA 2.0, GAMS and AEO25 comparison data were used.
Source type is SSRN preprint research paper. Because text explicitly states “This preprint research paper has not been peer reviewed”, study has not undergone peer review. Findings should therefore be considered preprint-level modeling results under specific assumptions, not final peer-reviewed conclusions.
This study is not an experimental field application. It does not present outcomes from implementing and measuring a specific real-world EV policy. Findings are scenario projections generated by TIMES least-cost optimization. Model uses energy demand, technology cost, vehicle lifetime, electricity-generation mix and emission constraints as inputs.
Дар ин article no policy guarantee, commercial-success claim, exact technology outcome or claim that all emission problems are solved has been added beyond source. Results should especially be read in US light-duty vehicle and electricity-generation context. For other countries, grid structure, vehicle market, energy policy, renewable potential, nuclear-energy decisions, natural-gas dependence and consumer behavior must be considered.
Study was supported by National Science Foundation Engineering Research Center for Advancing Sustainability through Powered Infrastructure for Roadway Electrification (ASPIRE). ConTex grant support is also noted. Funder views are not necessarily represented by study views.
Шарҳ гузоред
Нишонии почтаи электронии шумо нашр намешавад. Майдонҳои ҳатмӣ бо * нишон дода шудаанд