

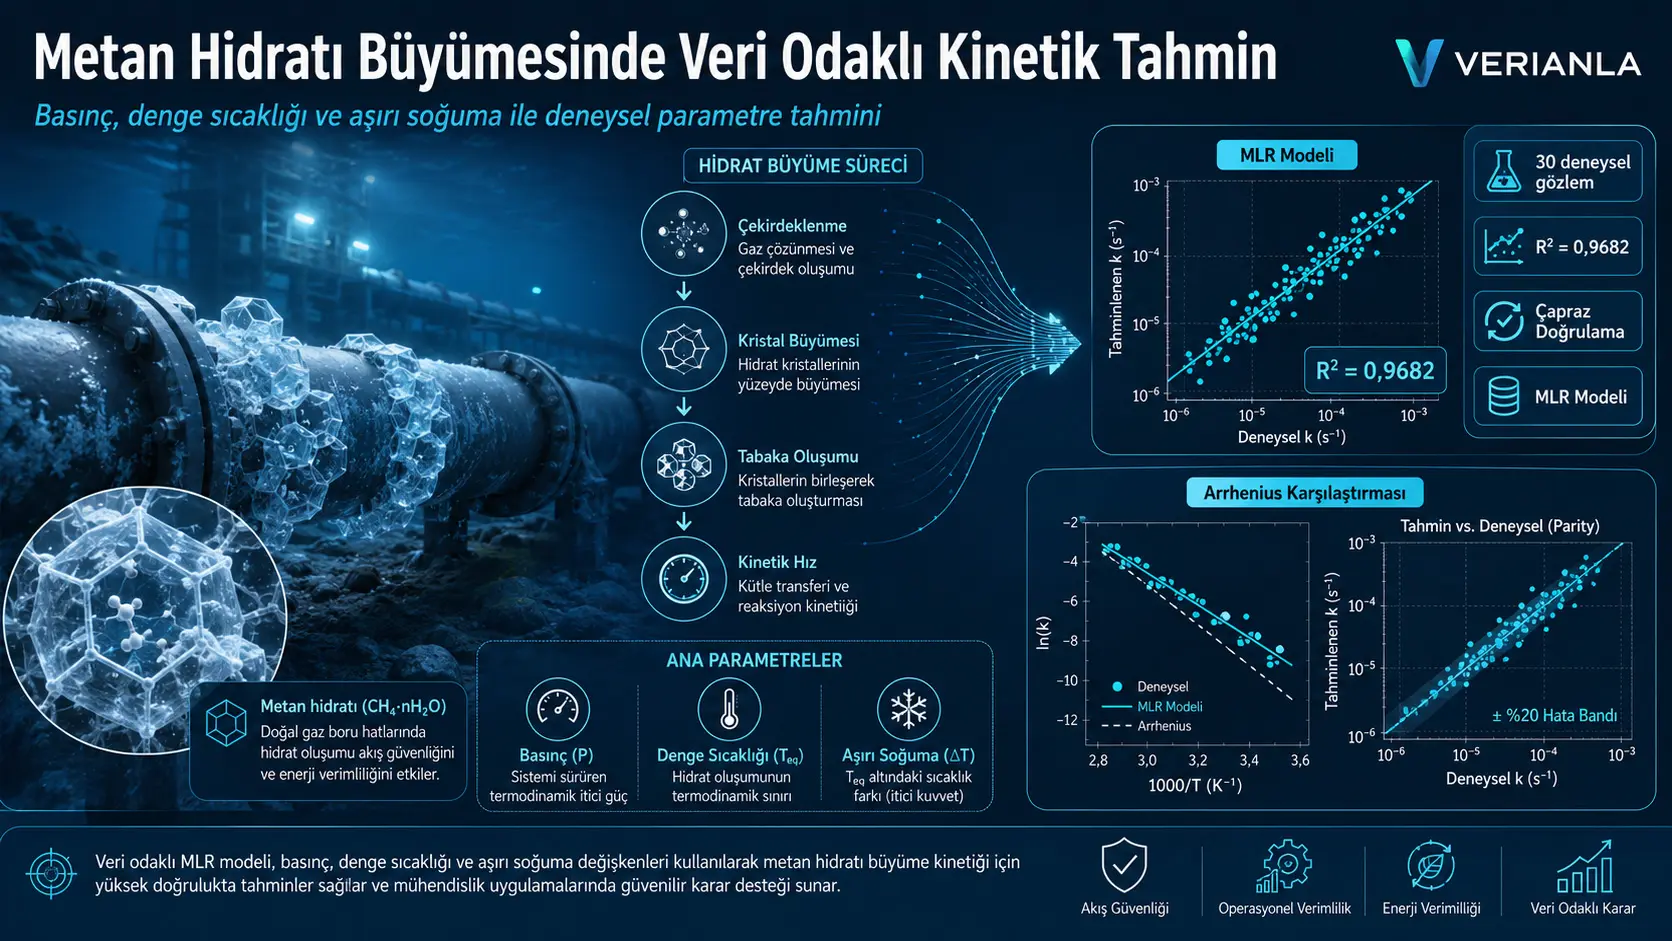
Ин таҳқиқот меомӯзад, ки оё apparent ё effective kinetic parameter-и аз methane hydrate growth experiments ҳисобшуда бо як data model-и содда ва interpretable пешгӯӣ карда мешавад ё не. Researcher 30 observation-ро аз як experimental study-и қаблан published истифода бурда, pressure, hydrate equilibrium temperature ва subcooling-ро ҳамчун inputs-и multiple linear regression model интихоб кардааст. Seven different variable combinations бо same 10-fold cross-validation method муқоиса шудаанд.
Most successful model, Model 7, pressure, equilibrium temperature ва subcooling-ро якҷоя истифода бурдааст. Барои ин model cross-validated R2 value 0,9682, root mean square error 3092,5 W/m²K ва mean absolute error 2429,1 W/m²K reported шудааст. Arrhenius model, ки бо same data ва validation method evaluated шуд, R2 = 0,9540, RMSE = 3712,0 W/m²K ва MAE = 2967,0 W/m²K дод. Regression model бо сабаби дохил кардани additional operating variables дар examined dataset lower prediction error таъмин кард.
Аммо quantity-и пешгӯишаванда pure reaction constant-и directly measured at molecular scale нест. Parameter аз experimental interface growth rate, hydrate formation heat, hydrate density ва heat-transfer coefficient derived шудааст. Аз ин сабаб он бояд ҳамчун apparent parameter арзёбӣ шавад, ки combined effects-и thermodynamic driving force, heat and mass transfer, interfacial phenomena ва experimental setup-ро дар бар мегирад. Model ҳам physical hydrate-growth law нест; он танҳо барои experiments resembling same conditions dataset-specific empirical approach пешниҳод мекунад.
Аз нигоҳи Туркия: Study дар Turkey барои natural-gas transmission pipelines, subsea pipeline systems, flow assurance, high-pressure processes ва energy engineering як useful methodological example медиҳад, ки small experimental datasets-ро бо transparent models арзёбӣ мекунад. Барои истифодаи approach дар Turkey бояд independent experimental data, ки local gas compositions, pipe and reactor geometries, flow conditions, salinity, inhibitors, mixing level ва heat-mass-transfer conditions-ро фаро мегирад, ҷамъоварӣ шавад. Model пеш аз transfer to different systems бояд with external data validated шавад, repeated or nested cross-validation applied гардад ва бо physical variables expanded шавад. Аз ин study hydrate blockage risk, safe operating limit ё inhibitor requirement of any pipeline in Turkey-ро directly calculate кардан мумкин нест.
Шарҳи муфассал
Масъалаи таҳқиқот чист?
Under high-pressure and low-temperature conditions, water molecules метавонанд тавассути hydrogen bonds cage-like crystalline structures ташкил диҳанд ва small gas molecules such as methane-ро inside these cages нигоҳ доранд. Solid crystalline structures-и ҳосилшуда gas hydrates ном доранд.
Дар systems where natural gas is transported through long pipelines, loss of heat from fluid to environment or cooling due to pressure drop метавонад system-ро ба temperature-pressure region барад, ки hydrates stable мебошанд. Growth and agglomeration of hydrate crystals метавонад pipe cross-section-ро narrow кунад, pressure loss-ро increase кунад ва дар advanced stage pipeline blockage ба вуҷуд орад.
Аз ин рӯ, танҳо донистани temperature and pressure-и thermodynamic stability of hydrates кофӣ нест. Фаҳмидани nucleation rate, growth rate ва time required to create operational risk ҳам зарур аст.
Methane hydrate formation аз кадом stages мегузарад?
Figure 1 on page 4-и study typical gas-consumption curve-ро ба four qualitative stages ҷудо мекунад:
- Stage I — Gas dissolution and induction: Gas дар aqueous phase dissolves; induction period то macroscopic detection of stable hydrate nuclei идома мекунад.
- Stage II — Rapid growth: Stable nuclei grow ва gas rapidly incorporated into hydrate phase мешавад. Ин steepest region-и gas-consumption curve аст.
- Stage III — Slowing growth: Crystal structures continue growing, аммо gas-consumption rate begins to decrease.
- Stage IV — Stable or limited condition: Gas consumption very slow мешавад. Ин stage одатан бо mass-transfer limitations алоқаманд аст.
Research махсусан ба kinetic parameter derived from hydrate growth experiments focuses мекунад. Аммо дар real experiment interfacial reaction, gas transport through liquid, diffusion to crystal surface ва removal of formation heat from environment метавонанд simultaneously occur.
Чаро “kinetic parameter” apparent ё effective аст?
An ideal intrinsic kinetic constant бояд танҳо molecular reaction rate at hydrate-water-gas interface-ро represent кунад. k parameter-и examined study direct molecular measurement нест. Он аз interface motion rate observed in previously published experiments ва thermal-balance expressions calculated шудааст.
Аз ин рӯ k value метавонад combined effects-и зеринро дар бар гирад:
- True reaction kinetics at hydrate surface,
- Gas dissolution and transport in liquid phase,
- Mass-transfer resistance at interface,
- Removal of heat released by hydrate formation,
- Geometry and mixing conditions of experimental vessel,
- Thermodynamic driving force produced by pressure and fugacity,
- Transport limitations developing in hydrate film or porous structure.
Researcher therefore emphasizes that model estimates not an “intrinsic reaction constant” but an apparent kinetic parameter reflecting combined effects of experimental system.
Role of Arrhenius approach
Дар conventional kinetic studies temperature dependence often expressed by Arrhenius equation:
\[ k=A\exp\left(-\frac{E_a}{RT_{\mathrm{eq}}}\right) \]
Here:
- k: Kinetic parameter or rate constant,
- A: Arrhenius pre-exponential factor,
- Ea: Activation energy,
- R: Universal gas constant,
- Teq: Equilibrium temperature in Kelvin.
Arrhenius model provides physical basis for effect of temperature on reaction rate. In contrast, standard form does not explicitly include pressure, subcooling, gas fugacity or experimental transport conditions as separate variables.
Main approach of study is not to invalidate Arrhenius model, but to test whether a transparent regression model including additional variables such as pressure and subcooling improves empirical fit on same dataset.
Dataset used
Data were taken from 2001 methane-hydrate film-growth experiments by Freer and colleagues. Total of 30 observations. Each observation contains:
- Pressure, P,
- Hydrate equilibrium temperature, Teq,
- Bulk or experimental-environment temperature, Tb,
- Subcooling, ΔT = Teq − Tb,
- k parameter calculated from experimental data.
| Variable | Mean | Standard deviation | Minimum | Maximum |
|---|---|---|---|---|
| Pressure, P | 6,584 MPa | 1,693 MPa | 3,55 MPa | 9,06 MPa |
| Equilibrium temperature, Teq | 8,753 °C | 2,595 °C | 3,0 °C | 12,1 °C |
| Bulk temperature, Tb | 2,333 °C | 1,269 °C | 1,0 °C | 4,0 °C |
| Subcooling, ΔT | 6,420 °C | 2,738 °C | 2,0 °C | 11,1 °C |
| Kinetic parameter, k | 29.695,7 W/m²K | 17.625,3 W/m²K | 4.553,5 W/m²K | 65.691,9 W/m²K |
Only 30 observations require model complexity to remain limited. For this reason researcher chose multiple linear regression as primary model instead of highly parameterized methods such as artificial neural networks.
Kinetic parameter чӣ гуна calculated шуд?
Study first gives heat balance for moving hydrate interface:
\[ \lambda_H\rho_H\frac{dX}{dt}=K(T_{\mathrm{eq}}-T_b) \]
Here:
- λH: Heat of hydrate formation or dissociation,
- ρH: Methane-hydrate density,
- dX/dt: Advance rate of hydrate interface,
- K: Overall reaction or transfer coefficient,
- Teq − Tb: Subcooling.
Relationship of overall coefficient to kinetic and heat-transfer resistances expressed as:
\[ \frac{1}{K}=\frac{1}{k}+\frac{1}{h} \]
Here h is heat-transfer coefficient of experimental system. Rearranging two expressions gives:
\[ \frac{1}{k}=\frac{T_{\mathrm{eq}}-T_b}{\lambda_H\rho_H\left(dX/dt\right)}-\frac{1}{h} \]
equation.
Constants used in calculation:
| Parameter | Value used |
|---|---|
| Methane-hydrate formation/dissociation heat, λH | 436,5 kJ/kg |
| Methane-hydrate density, ρH | 897,0 kg/m³ |
| Heat-transfer coefficient, h | 42.326 W/m²K |
Interface rate in experimental source was given in µm/s and converted to m/s before calculation. To ensure unit consistency in watts within thermal equation, hydrate heat must also be converted from kJ/kg to J/kg; study does not share calculation code, so implementation details of this conversion cannot be directly audited.
Scatter plots on page 13 чӣ нишон медиҳанд?
Figure 2 plots k parameter separately against four variables:
- Pressure: Strong and approximately monotonic increase in k as pressure rises.
- Equilibrium temperature: k generally increases as equilibrium temperature rises.
- Bulk temperature: Data cluster around 1, 2 and 4 °C and show no clear linear trend.
- Subcooling: k clearly increases as ΔT rises.
Researcher states no important outlier was identified and no observation removed because of small dataset. However relationships visible in plots belong only to this experimental range and do not mean hydrate growth is fundamentally linear.
Correlation analysis
| Variable pair | Pearson correlation coefficient |
|---|---|
| P and k | 0,969128 |
| Teq and k | 0,936100 |
| ΔT and k | 0,929372 |
| Tb and k | −0,091077 |
| P and Teq | 0,987085 |
| P and ΔT | 0,894441 |
| Teq and ΔT | 0,888219 |
Pressure, equilibrium temperature and subcooling show correlations above 0,9 with k. In contrast direct relation of bulk temperature is very weak.
However correlations among inputs themselves are also very high. Especially 0,987 correlation between P and Teq indicates serious multicollinearity. Therefore coefficients in final model should not be interpreted as independent physical effects or causal changes.
Чаро bulk temperature ба final model дохил нашуд?
Bulk temperature showed weak direct correlation with k. Also subcooling already calculated by:
\[ \Delta T=T_{\mathrm{eq}}-T_b \]
Adding Tb, Teq and ΔT simultaneously would create mathematically redundant information. Researcher therefore excluded bulk temperature from candidate-model set and focused on pressure, equilibrium temperature and subcooling.
Nevertheless using ΔT does not mean information from Tb is completely removed. Effect of bulk temperature remains indirectly inside subcooling variable.
Random forest importance analysis
Study also provides exploratory random-forest variable-importance values in addition to Pearson correlation:
| Variable | Random Forest Classifier | Random Forest Regressor |
|---|---|---|
| ΔT | 0,366 | 0,373 |
| P | 0,219 | 0,311 |
| Teq | 0,216 | 0,309 |
| Tb | 0,199 | 0,007 |
Regressor results rank subcooling highest, pressure and equilibrium temperature close to one another, and bulk temperature very low. This ordering aligns with general trend in correlation analysis.
In contrast, study does not explain how “Random Forest Classifier” was applied to continuous target variable, whether k values were transformed into classes, or which hyperparameters were used. Researcher also did not use this analysis as main basis of model selection, presenting it only as exploratory comparison.
Which regression models were compared?
| Model | Inputs | Purpose |
|---|---|---|
| M1 | P | Single-variable pressure model |
| M2 | Teq | Single-variable equilibrium-temperature model |
| M3 | ΔT | Single-variable subcooling model |
| M4 | P, Teq | Two-variable model |
| M5 | P, ΔT | Two-variable model |
| M6 | Teq, ΔT | Two-variable model |
| M7 | P, Teq, ΔT | Final three-variable surrogate model |
Multiple linear regression structure
General multiple linear regression model given as:
\[ Y=\beta_0+\beta_1X_1+\beta_2X_2+\cdots+\beta_nX_n+\varepsilon \]
Here Y is predicted output, X variables are inputs, β0 intercept, β coefficients model weights of inputs and ε unexplained error term.
For this study final Model 7 equation is:
\[ k=-37157{,}28+15892{,}08P-5901{,}97T_{\mathrm{eq}}+2162{,}22\Delta T \]
P is in MPa, Teq and ΔT in °C; predicted k unit is W/m²K.
Pressure coefficient is positive, equilibrium-temperature coefficient negative and subcooling coefficient positive. Although equilibrium temperature alone has positive correlation with k, its coefficient becomes negative in multivariable model because variables are very strongly interrelated. These coefficients should not be interpreted as magnitudes of separate physical mechanisms.
Method flow on page 16
Figure 3 shows research workflow as:
- Data preparation and preprocessing,
- Definition of all candidate features,
- Preliminary exploratory analysis,
- Variable selection through correlation and physical reasoning,
- Building MLR models with selected inputs,
- Prediction of experimental kinetic parameter,
- Comparison of models using common validation metrics.
Flowchart appears to label output as “intrinsic rate parameter”. In contrast main text explicitly says calculated parameter is not pure intrinsic constant and contains system-level effects. There is terminological inconsistency between wording in figure and more cautious definition in text.
10-fold cross-validation чӣ гуна applied шуд?
Total dataset divided into 10 parts. In each round nine parts used for training and remaining one for testing; process repeated until each part served once as test data.
Because total only 30 observations, each test fold contains approximately three observations. This makes data use efficient but can make R2 and error metrics in each fold sensitive to very few observations.
Study does not report random seed used to create folds, whether data were shuffled, how many times cross-validation was repeated, or standard deviation of performance across folds. Therefore variation under a different fold split is unknown.
Also seven candidate models compared using same cross-validation results and best one selected. Because no separate external test set or nested cross-validation used, reported final performance may include some optimism from model selection.
Validation metrics used
Coefficient of determination
\[ R^2=\frac{\sum_{i=1}^{n}(\hat{y}_i-\bar{y})^2}{\sum_{i=1}^{n}(y_i-\bar{y})^2} \]
R2 shows extent to which predictions represent observed variability. Value approaching 1 indicates stronger fit. However high R2 alone does not prove relation is causal or physically correct.
Root mean square error
\[ RMSE=\sqrt{\frac{1}{N}\sum_{i=1}^{N}(\hat{y}_i-y_i)^2} \]
RMSE penalizes large errors more strongly because of squaring. In this study unit is same as k, W/m²K.
Mean absolute error
\[ MAE=\frac{1}{N}\sum_{i=1}^{N}|y_i-\hat{y}_i| \]
MAE shows average absolute prediction difference and is less sensitive than RMSE to large individual errors.
Results of seven regression models
| Model | Regression equation | Cross-validated R2 | RMSE | MAE |
|---|---|---|---|---|
| M1 | k = −36.734,72 + 10.089,68P | 0,9207 | 4881,1 | 3993,3 |
| M2 | k = −25.954,17 + 6357,57Teq | 0,8398 | 6936,7 | 5307,4 |
| M3 | k = −8708,88 + 5982,03ΔT | 0,8406 | 6917,8 | 5678,5 |
| M4 | k = −43.298,67 + 18.303,27P − 5428,14Teq | 0,9395 | 4261,2 | 3391,9 |
| M5 | k = −30.483,32 + 7177,21P + 2013,13ΔT | 0,9480 | 3951,7 | 3013,1 |
| M6 | k = −20.628,64 + 3559,23Teq + 2985,86ΔT | 0,9070 | 5285,4 | 4125,2 |
| M7 | k = −37.157,28 + 15.892,08P − 5901,97Teq + 2162,22ΔT | 0,9682 | 3092,5 | 2429,1 |
Among single-variable models pressure model M1 gave best result. Pressure alone achieved R2 = 0,9207 and explained large portion of variation in k within dataset.
Adding equilibrium temperature or subcooling to pressure improved performance. Among two-variable models M5 using P and ΔT performed best with R2 = 0,9480.
Three-variable M7 produced highest R2 and lowest RMSE and MAE among all compared regressions.
Comparison of predicted and experimental values
Figure 4 on page 22 compares k values predicted by Model 7 with experimentally derived values. Most points cluster around diagonal line representing perfect agreement.
Fit appears generally strong at low and medium k values. In contrast around 50.000–65.000 W/m²K some points deviate more noticeably from ideal line. This indicates absolute errors may increase in high-k region.
Residual plot чӣ нишон медиҳад?
Supplementary Figure S1 on page 23 plots difference between experimental value and prediction against predicted k. Residuals occur both above and below zero line and study states no clear systematic pattern.
However in high-prediction range residuals approaching about +10.000 and −5.000 W/m²K are visible. Because data count is small, strong conclusions cannot be drawn about normal distribution of residuals, constant-variance assumption or influential observations.
Study does not report residual normality, heteroscedasticity, leverage values, Cook’s distance or prediction intervals.
Comparison with Arrhenius model
| Model | Cross-validated R2 | RMSE | MAE |
|---|---|---|---|
| Arrhenius | 0,9540 | 3712,0 W/m²K | 2967,0 W/m²K |
| MLR Model 7 | 0,9682 | 3092,5 W/m²K | 2429,1 W/m²K |
Regression model increased R2 by 0,0142 relative to Arrhenius model; reduced RMSE by 619,5 W/m²K and MAE by 537,9 W/m²K.
Arrhenius model said to yield activation energy of approximately 173 kJ/mol. However Arrhenius pre-exponential coefficient, how parameters were refitted in each cross-validation fold, and uncertainty of activation energy are not explained.
Figure 5 on page 24 shows both Arrhenius and MLR predictions around ideal-fit line. Close results of two approaches support dominant role of temperature in dataset. Additional advantage of MLR is ability to separately use pressure and subcooling information.
MLR model-и better statistical fit чӣ маъно дорад?
Lower error indicates MLR follows variation within examined 30 observations slightly better than Arrhenius model. This does not mean:
- MLR represents hydrate-growth physics more accurately than Arrhenius model,
- Pressure or temperature coefficients are causal quantities,
- Model can be safely used outside study range,
- Model is valid for different reactors and gas compositions,
- Intrinsic molecular reaction constant is being estimated.
Arrhenius equation provides physical interpretation through temperature and activation energy, while MLR represents multivariable pattern in dataset more flexibly. Research treats two approaches as complementary rather than competing tools.
Possible meaning of strong pressure effect
Pressure was strongest predictor among single-variable models. Study relates this to effects of pressure on gas fugacity, hydrate-formation driving force and amount of methane available at interface.
However in dataset pressure and equilibrium temperature have extremely strong correlation of 0,987. Therefore pressure coefficient cannot be said to represent pressure-specific effect alone. In experimental design pressure change progressed together with change in equilibrium temperature.
Strengths of study
- Simple and explainable model appropriate for small dataset selected.
- Seven different input combinations compared using same validation method.
- Effects of pressure, temperature and subcooling evaluated separately and together.
- Model assessed not only by training fit but by 10-fold cross-validation.
- RMSE and MAE reported alongside R2.
- Arrhenius model compared using same data and validation approach.
- Researcher explicitly states MLR is not physical mechanism.
- Multicollinearity and dataset-specific validity acknowledged in source.
- Prediction-observed and residual plots presented.
- Future combination of physics-based and data-driven methods proposed.
Main limitations of study
- Study is preprint not peer reviewed.
- Dataset contains only 30 observations.
- All data taken from single older experimental study.
- No independent external validation from different laboratory, reactor or setup.
- Very high correlation between pressure and equilibrium temperature.
- No standard errors or confidence intervals showing stability of regression coefficients.
- Multicollinearity measures such as variance inflation factor not calculated.
- Random seed and repeat count of cross-validation folds not explained.
- No performance distribution or standard deviation across folds.
- No separate external test set or nested cross-validation.
- Dependence structure of data within same experimental series not assessed.
- Model assumes only linear relationship.
- Interaction terms or nonlinear terms not examined.
- Normality and constant variance of residuals not statistically tested.
- How Random Forest Classifier used for continuous target not explained.
- Regression and analysis codes not shared.
- Raw 30 observations not presented as complete table in article.
- Arrhenius pre-exponential coefficient and activation-energy uncertainty not provided.
- Gas fugacity, interfacial area, diffusivity and mass-transfer coefficient not directly included in model.
- Model not tested with different gas compositions, salts, inhibitors or flowing systems.
Important reporting issues in source
- Method schematic on page 16 labels output “intrinsic rate parameter”, while main text states parameter is apparent and includes system effects.
- How Random Forest Classifier applied to continuous k target not explained.
- Although R2 explanation uses phrase “R-squared / adjusted R-squared”, adjusted R2 is not separately reported in table.
- Random-split details and repeat count of cross-validation not given.
- Arrhenius fit pre-exponential factor and uncertainties not presented.
- Code and complete data table enabling reproduction of calculations not shared.
- Despite strongly correlated inputs in Model 7, coefficient uncertainties not given.
- Unit conversions used in calculation of k not explained at code level.
Which conclusions are supported?
- Within examined 30 observations, pressure, equilibrium temperature and subcooling show strong statistical relationships with k parameter.
- Bulk temperature alone shows weak linear relation with k.
- Pressure was most successful predictor among single-variable models.
- M7 using P, Teq and ΔT together gave lowest cross-validation error among tested regressions.
- Arrhenius model also showed strong prediction performance on same dataset.
- Use of additional operating variables improved dataset-specific empirical fit.
- Simple linear models can serve as transparent surrogate tools for examining small hydrate-kinetics datasets.
- MLR and Arrhenius approaches can complement one another for different purposes.
Which conclusions are not proven?
- Does not prove model is intrinsic hydrate-growth law at molecular scale.
- Does not show regression coefficients are independent causal effects.
- Does not show model is valid in other reactors, pipelines or gas compositions.
- Does not predict blockage time of a real pipeline.
- Does not calculate need for hydrate inhibitor or dispersant chemical.
- Does not separate heat- and mass-transfer effects.
- Does not prove MLR is physically superior to Arrhenius model.
- Does not show high R2 establishes a new general physical law.
- Does not show model can safely extrapolate to pressures and temperatures outside data range.
Усул ва бозёфтҳои таҳқиқот
Method summary
| Method component | Approach used in study |
|---|---|
| Study type | Secondary experimental-data analysis and comparative regression modeling |
| Data source | 2001 methane-hydrate film-growth experiments by Freer and colleagues |
| Number of observations | 30 |
| Target variable | Apparent kinetic parameter k derived from experimental data |
| Target unit | W/m²K |
| Candidate inputs | P, Teq, Tb, ΔT |
| Final inputs | P, Teq, ΔT |
| Main model | Multiple linear regression |
| Comparison model | Arrhenius-type model |
| Variable selection | Pearson correlation, physical reasoning and exploratory random-forest importance analysis |
| Number of candidate models | 7 |
| Validation | 10-fold cross-validation |
| Performance metrics | R2, RMSE and MAE |
| External validation | None |
| Software | Python and Scikit-Learn reported as used |
Final model and application range
\[ k=-37157{,}28+15892{,}08P-5901{,}97T_{\mathrm{eq}}+2162{,}22\Delta T \]
This equation evaluated only within approximate ranges in study:
| Variable | Range supporting model |
|---|---|
| P | 3,55–9,06 MPa |
| Teq | 3,0–12,1 °C |
| Tb | 1,0–4,0 °C |
| ΔT | 2,0–11,1 °C |
| k | 4.553–65.692 W/m²K |
Use of equation outside these ranges not validated by study. Because linear model does not enforce physical limits, inappropriate inputs can produce negative or unrealistic predictions.
Basic performance comparison
| Metric | Arrhenius | MLR Model 7 | MLR difference |
|---|---|---|---|
| R2 | 0,9540 | 0,9682 | +0,0142 |
| RMSE | 3712,0 W/m²K | 3092,5 W/m²K | −619,5 W/m²K |
| MAE | 2967,0 W/m²K | 2429,1 W/m²K | −537,9 W/m²K |
Mean absolute error of Model 7 corresponds to approximately eight percent of dataset mean k value of about 29.696 W/m²K. However this ratio alone does not show error distribution across observations or larger errors in high-k region.
Researcher’s future-work suggestions
- Expand experimental database,
- Examine broader pressure and temperature ranges,
- Add different gas compositions and reactor configurations,
- Use gas fugacity directly as input,
- Add interfacial area, diffusivity and mass-transfer coefficient to model,
- Carefully compare more advanced machine-learning models,
- Preserve interpretability in small datasets,
- Hybridize physics-based hydrate models with data-driven methods.
Statistical-evaluation limit
Performance values in study obtained on single dataset of 30 observations. Because no independent experimental external test data exist, R2 = 0,9682 cannot be interpreted as general-use success.
Strong correlation among pressure, equilibrium temperature and subcooling does not necessarily invalidate model prediction, but can cause coefficients to be sensitively allocated among variables and become unstable on new data. Therefore primary use of model is approximate prediction of k values under similar conditions, not independent physical interpretation.
Ёддошти манбаъ ва усул
Full original title: A Data-Driven Approach for Estimating an Experimentally Derived Kinetic Parameter in Methane Hydrate Growth
Author: Chinedu Charles Alamezie
Author order: Study has one author.
Equal first author or equal contribution: None.
Corresponding author: Chinedu Charles Alamezie
Institutional affiliation: School of Engineering, University of Aberdeen, Aberdeen AB24 3UE, Scotland, United Kingdom
Corresponding-author email: ccalamezie@hotmail.com
ORCID: No ORCID information in uploaded version.
Journal: Not published in peer-reviewed journal.
Original journal publisher: None.
Publication platform: SSRN
Publication date: 15 June 2026
Page count: 33
Source type: Preprint research study containing secondary experimental-data analysis and regression modeling
Peer-review status: Study has not undergone peer review. Every page of uploaded version states preprint is not peer reviewed.
Official link:Official SSRN preprint page
Ин шарҳи тоҷикӣ бо examining text of uploaded study, equations, four main figures, supplementary residual plot, six tables, correlation matrix, random-forest importance values, seven regression equations, cross-validation results, Arrhenius comparison, conclusions and recommendations омода шудааст.
External sources used only for bibliographic verification of author name, institution, SSRN publication date, DOI, page count and official link. No new result from external sources added to scientific findings of study.
Main limitations are small single-source dataset, strong correlations among variables, lack of independent external validation, absence of repeated or nested cross-validation, no uncertainty estimates for regression coefficients, and predicted parameter combining thermodynamic and transfer effects rather than representing pure intrinsic kinetics. Model should be viewed not as a general law replacing physical hydrate-growth equations, but as transparent dataset-specific surrogate model usable under similar experimental conditions.
Шарҳ гузоред
Нишонии почтаи электронии шумо нашр намешавад. Майдонҳои ҳатмӣ бо * нишон дода шудаанд