

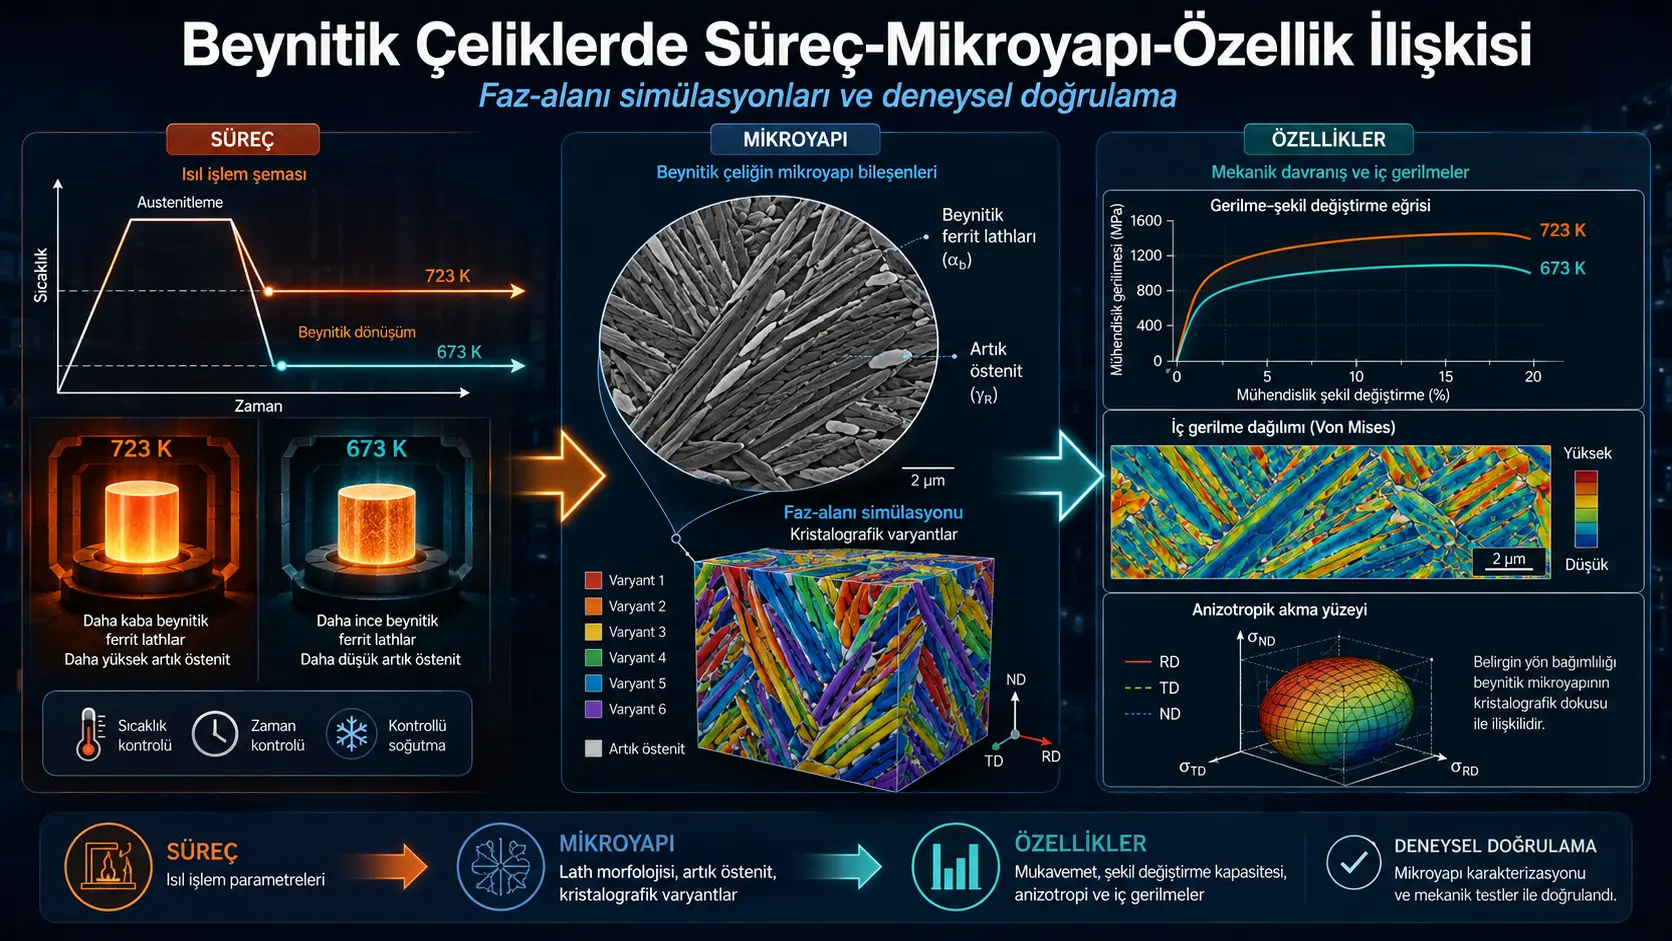
Ин таҳқиқот бо якҷоя кардани experiments ва three-dimensional phase-field simulations омӯхтааст, ки heat-treatment conditions-и bainitic steel transformation kinetics, microstructure form, transformation-induced internal stresses ва mechanical behavior-ро чӣ гуна тағйир медиҳанд. Laboratory steel бо composition-и Fe–0,19C–1,48Si–2,38Mn weight percent пас аз austenitization дар 673 K ё 723 K барои 45 дақиқа isothermally held шудааст. Дар experiments, treatment-и 673 K finer bainitic ferrite ва yield strength-и 765 ± 5 MPa, treatment-и 723 K thicker ferrite ва yield strength-и 667 ± 5 MPa дод. Phase-field model temperature trend ва general ordering-и experimental tensile curves-ро reproduced кард; аммо bainitic ferrite thickness-ро дар ҳар ду temperature overestimated кард. Multiaxial yielding behavior бо Barlat91 model estimated шуд, аммо танҳо uniaxial tensile response дар x direction experimentally tested шуд.
Мувофиқи model results, lower holding temperature larger undercooling ва stronger transformation driving force медиҳад. Баланд кардани heat-extraction coefficient аз 0,25 s−1 ба 0,5 s−1 cooling ва transformation-ро тез мекунад, барои mechanical relaxation time камтар мегузорад ва higher transformation-induced internal stresses тавлид мекунад. Largest model yield surface дар 673 K ва 0,5 s−1 condition гирифта шуд. Аммо simulations бо 0,25 s−1 experimental tensile curves-ро closer matched карданд. Аз ин рӯ highest model strength ва thermal path closest to experiment same condition нестанд.
Аз нигоҳи Туркия: Approach-и study метавонад барои automotive sheets, railway steels, gear ва bearing materials, heavy-machinery components, wear-resistant steels ва heat-treatment design дар Туркия applicable бошад. Domestic steel producers ва research centers метавонанд phase-field models-ро барои different alloy compositions бо dilatometer, SEM/EBSD, X-ray diffraction, hardness ва multidirectional mechanical tests validate карда, heat-treatment windows-ро бо fewer trial productions develop кунанд. Аммо current results бо single laboratory composition, two isothermal temperatures ва uniaxial-tension validation маҳдуданд. Strength, fatigue life, weldability, production cost ё industrial-furnace performance-и specific steel grade produced in Turkey аз ин study directly inferred шуда наметавонад.
Main problem-и research чист?
Bainitic steels арзишманданд, зеро high strength, fracture toughness ва wear resistance-ро дар same microstructure combine карда метавонанд ва дар automotive, railway, aerospace ва heavy-engineering applications истифода мешаванд. Аммо “bainite” uniform phase нест. Вобаста ба heat-treatment conditions, bainitic ferrite plates метавонанд дар:
- Thickness,
- Length,
- Orientation,
- Variant distribution,
- Amount of retained austenite between them,
- Local internal stresses they generate
фарқ кунанд. Ин features на танҳо uniaxial yield strength, балки plastic behavior under tensile, compressive ва shear loads applied from different directions-ро низ affect мекунанд.
Main research question чунин summarized мешавад: Holding temperature ва intensity of heat transfer to surroundings bainitic transformation-ро чӣ гуна тағйир медиҳанд; resulting three-dimensional microstructure, internal stress ва crystal orientations чӣ гуна ба mechanical strength ва anisotropic yield surface reflected мешаванд?
Process–microstructure–property chain proposed by study
Researchers кӯшиш карданд relationship-и зеринро establish кунанд:
Heat-treatment condition → temperature history → austenite-to-bainite transformation kinetics → bainitic ferrite morphology and retained austenite → transformation-induced internal stresses → tensile behavior and multiaxial yield surface.
First part-и chain бо phase-field model, mechanical part бо crystal plasticity, ва macroscopic anisotropic yield behavior бо Barlat91 phenomenological yield criterion represent шудааст.
Experimental steel чӣ гуна produced шуд?
Laboratory ingot of approximately 80 kg дар vacuum induction furnace produced шуд. Initial cross-section of ingot 140 × 140 mm² буд. Material at 1200 °C homogenized шуда, баъд ба billets with 60 × 60 mm² cross-section forged шуд. Second homogenization five hours давом кард ва furnace cooling follow кард.
| Element | Weight percent |
|---|---|
| Carbon | 0,19 |
| Silicon | 1,48 |
| Manganese | 2,38 |
| Phosphorus | 0,003 |
| Sulfur | 0,003 |
| Chromium | 0,04 |
| Molybdenum | 0,01 |
| Aluminum | 0,003 |
| Copper | 0,02 |
Composition бо optical emission spectroscopy ва carbon content бо combustion analysis муайян шуд.
Heat treatment чӣ гуна performed шуд?
Samples дар salt bath at 60 K above Ac3 temperature барои 300 seconds austenitized шуданд. Source exact Ac3 value-ро намедиҳад. Пас аз obtaining fully austenitic structure, samples quickly transferred to second salt bath шуданд.
Two isothermal treatments applied шуданд:
- Holding at 673 K for 45 minutes,
- Holding at 723 K for 45 minutes.
After holding, samples quenched in water to room temperature шуданд. Дар ҳар two treatments bainitic-ferrite-based microstructure formed шуд. Experimental images нишон медиҳанд, ки ferrite plates formed at 673 K thinner than those formed at 723 K мебошанд.
Experimental microstructure чӣ гуна examined шуд?
Sample surfaces ground up to 1200-grit SiC paper, polished with 6 and 1 µm diamond paste, ва etched with %3 Nital шуданд. Secondary electron images дар field-emission Zeiss Sigma microscope бо:
- 30 µm aperture,
- 15 kV accelerating voltage,
- 9 mm working distance
гирифта шуданд.
Figure 5-и study “inverse pole figure maps” барои samples at 673 ва 723 K медиҳад. Such orientation maps normally based on electron backscatter diffraction data мебошанд; аммо дар this version EBSD instrument, step size, indexing rate ва data-cleaning procedures explained нашудаанд.
Phase-field model чиро represent мекунад?
Дар phase-field method ҳар phase ё crystal variant бо continuous field variable represent мешавад, ки бо space ва time changes мешавад. Instead of explicitly tracking sharp boundary, boundary between phases ҳамчун transition region of finite thickness resolve мешавад.
Temporal change of phase fields бо following multiphase kinetic equation expressed шудааст:
\[ \dot{\phi}_{\alpha}(\mathbf{x},t) = -\frac{1}{N} \sum_{\beta\neq\alpha} M_{\alpha\beta} \left( \frac{\delta F}{\delta\phi_{\alpha}} - \frac{\delta F}{\delta\phi_{\beta}} \right). \]
Дар ин ҷо \(\phi_{\alpha}\) field variable of particular phase or variant, \(M_{\alpha\beta}\) interface mobility ва \(F\) total free energy-ро нишон медиҳад.
Total free energy:
\[ F=\int_{\Omega} \left( f_{\mathrm{chem}}+ f_{\mathrm{int}}+ f_{\mathrm{el}} \right)d\Omega \]
defined шудааст. Three main contributions:
- Chemical energy: Thermodynamic driving force enabling phase transformation,
- Interface energy: Cost of forming phase and variant boundaries,
- Elastic energy: Mechanical energy from transformation strain and lattice mismatch.
Carbon transport чӣ гуна handled шуд?
Local carbon concentration бо diffusion equation solved шуд:
\[ \dot{c}= \nabla\cdot \left[ \sum_{\alpha}\phi_{\alpha}D_{\alpha}\nabla c_{\alpha} + \sum_{\alpha,\beta}J_{\alpha\beta} \right]. \]
\(D_{\alpha}\) diffusion coefficient matrix of each phase, ва \(J_{\alpha\beta}\) anti-trapping flux used to reduce artificial solute trapping that may occur in diffuse-interface approach-ро represent мекунад.
Phase-field ва diffusion equations on a regular grid with finite-difference method discretized шуданд, time integration бо explicit forward Euler method иҷро шуд.
Transformation-induced stresses чӣ гуна calculated шуданд?
Model under finite deformation elastic, plastic ва transformation components-ро multiplicatively decomposed кард:
\[ \mathbf{F} = \mathbf{F}^{el} \mathbf{F}^{pl} \mathbf{F}^{tr}. \]
Here:
- \(\mathbf{F}^{el}\), elastic deformation gradient,
- \(\mathbf{F}^{pl}\), plastic deformation gradient,
- \(\mathbf{F}^{tr}\), deformation gradient arising from phase transformation.
Elastic strain бо Green–Lagrange measure ва St. Venant–Kirchhoff hyperelastic approach ҳисоб шуд. Mechanical equilibrium problem бо fast-Fourier-transform-based spectral solver solved шуд.
Crystal plasticity model
Plastic deformation ҳамчун sum of active slip systems in crystal represent шуд:
\[ \mathbf{L}^{p} = \sum_{s=1}^{N} \dot{\gamma}^{s} \mathbf{m}^{s}\otimes\mathbf{n}^{s}. \]
\(\dot{\gamma}^{s}\) slip rate of corresponding slip system, \(\mathbf{m}^{s}\) slip direction ва \(\mathbf{n}^{s}\) normal to slip plane-ро нишон медиҳад.
Slip rate бо power law dependent on resolved shear stress given шуд:
\[ \dot{\gamma}^{s} = \dot{\gamma}_{0} \left| \frac{\tau^{s}}{\tau_{c}^{s}} \right|^{n} \mathrm{sgn}(\tau^{s}). \]
Change of slip resistance with plastic deformation бо hardening law calculated шуд. Study explicitly states that phenomenological crystal-plasticity model used is not directly temperature-dependent.
Heat extraction and latent heat чӣ гуна modeled шуданд?
Sample temperature бо extended form of Newton cooling law including transformation latent heat calculated шуд:
\[ \dot{T}(t) = -r\left[T(t)-T_s\right] + \frac{Q}{\rho C_p}\dot{f}. \]
Here:
- \(T\), sample temperature,
- \(T_s\), cooling-medium or bath temperature,
- \(r\), heat-extraction coefficient,
- \(Q\), latent heat of bainitic transformation,
- \(\rho\), density,
- \(C_p\), specific heat,
- \(\dot{f}\), rate of change of transformed phase-volume fraction.
Latent heat released during transformation can temporarily slow cooling or create small reheating. Plateau or rise around approximately fifth second in Figure 3 was explained by this effect.
Three-dimensional simulation setup
| Parameter | Value given in source |
|---|---|
| Computational domain | 128 × 128 × 128 µm³ |
| Grid spacing | 0,1 µm |
| Interface thickness | 5 grid cells, approximately 0,5 µm |
| Interface mobility | 1 × 10⁻¹³ m⁴/J·s |
| Interface energy | 0,24 J/m² |
| Initial temperature | 900 K |
| Initial carbon | %0,2 by weight |
| Nucleus density | 7,5 × 10¹⁷ m−3 |
| Bath temperatures | 673 and 723 K |
| Heat-extraction coefficients | 0,25 and 0,5 s−1 |
| Boundary condition | Periodic in three directions |
Figure 2 shows three-dimensional microstructures for each thermal condition. Different colors represent 24 Kurdjumov–Sachs bainitic-ferrite variants, black regions represent retained austenite.
Temperature curves чиро showed карданд?
All four calculations started from 900 K. As expected, 673 K bath conditions reached lower final temperature. At same bath temperature:
- \(r=0{,}5\ \mathrm{s}^{-1}\) created faster initial cooling,
- \(r=0{,}25\ \mathrm{s}^{-1}\) created longer transient cooling process
.
Bath temperature was interpreted as main variable determining final thermal level, while heat-extraction coefficient determined rate of reaching this level.
Bainitic ferrite volume fraction
In Figure 4 bainitic-ferrite volume fraction increased as temperature decreased. 673 K conditions reached higher final bainitic-ferrite fraction within simulation time than 723 K conditions.
Heat-extraction coefficient did not change final phase fraction as strongly as temperature, but significantly affected how fast transformation occurred and resulting morphology. 723 K and 0,25 s−1 condition gave lowest final bainitic-ferrite fraction.
Experimental and calculated ferrite thickness
| Holding temperature | Experimental average | Experimental range | Phase-field result |
|---|---|---|---|
| 673 K | 0,15 ± 0,05 µm | Approximately 0,10–0,20 µm | 0,341 µm |
| 723 K | 0,26 ± 0,08 µm | Approximately 0,18–0,34 µm | 0,382 µm |
Experiment and simulation showed same trend: bainitic ferrite becomes thicker as holding temperature rises. However calculated values are absolutely larger. Difference especially pronounced at 673 K.
Researchers related this deviation to model resolution and limitation of image-based thickness determination. In simulation statistics ferrite thickness represented by approximately 6–7 pixels, therefore small differences may remain within grid uncertainty.
Area, length and shape statistics
Figure 6 compares distributions of area, aspect ratio, length and thickness. According to source interpretation:
- 673 K and 0,5 s−1 produced largest area and longest bainitic features.
- 673 K conditions associated with more elongated features.
- 723 K conditions showed shorter and more compact features.
- At 723 K and 0,25 s−1, prolonged thermal exposure gave more time for lateral growth and coarsening.
- Differences in thickness distributions could not be reliably separated because of grid resolution.
Here “larger area or length” and “thicker ferrite” are not same metric. At 673 K and rapid heat extraction features may be longer and elongated, while plate thickness is physically expected to be thinner.
Area and length distributions were extracted only from simulation images. Experimental area and length distributions for comparison are absent.
Transformation-induced internal stresses
Figure 7 shows local von Mises stress distributions after four heat-treatment conditions. Stresses are not homogeneous in microstructure; they concentrate in specific ferrite plates, variant boundaries and mechanical-incompatibility regions.
Highest local stresses were calculated at 673 K and 0,5 s−1. Fast transformation produces transformation strain in short time and leaves less time for plastic relaxation. Slower heat extraction provides longer time for mechanical accommodation.
Scale in figure is approximately from 3,3 × 10⁷ to 1,3 × 10⁹ Pa. These values are not macroscopic tensile stress but local constrained stresses within computational volume. Since model does not include cracking, damage and all stress-relief mechanisms, absolute peak values should not be interpreted as directly measurable stress in real part.
Tensile tests
Uniaxial tensile tests were performed on B5×25 cylindrical specimens:
- Gauge diameter: 5 mm,
- Gauge length: 25 mm,
- Test temperature: room temperature,
- Strain rate: 0,001 s−1,
- Machine: ZwickRoell Z100 electromechanical universal testing machine.
| Heat treatment | Experimental yield strength |
|---|---|
| 673 K | 765 ± 5 MPa |
| 723 K | 667 ± 5 MPa |
673 K treatment provided approximately 98 MPa higher yield strength than 723 K. Researchers linked this difference to higher bainitic-ferrite fraction, finer ferrite structure and stronger transformation driving force created by lower temperature.
Number of test repetitions, whether ±5 MPa is standard deviation or another uncertainty measure, and which offset method was used to determine yield strength are not explained in source.
Experimental and calculated tensile curves
Figure 8 compares experimental curves with four simulation curves. Model reproduced that 673 K sample carries higher stress than 723 K sample for both heat-extraction coefficients.
Curves using \(r=0{,}25\ \mathrm{s}^{-1}\) gave closest results to experiments. In contrast simulations using \(r=0{,}5\ \mathrm{s}^{-1}\) predicted higher strength. Source explains this with:
- Faster transformation,
- Finer ferrite formation,
- More microstructural obstacles to plastic flow,
- Higher residual internal stress
.
Barlat91 yield surface чиро shows мекунад?
In uniaxial tension yielding can be expressed by single stress value. In multiaxial stress states, a yield surface separating elastic and plastic regions is needed.
Study used Barlat91 criterion capable of representing six stress components and anisotropic behavior. General form of model:
\[ \Phi=2\sigma_y^n \]
was defined, using second and third stress invariants and six anisotropy parameters. Source states \(n=6\) for BCC materials and \(n=8\) for FCC materials. It is not explicitly stated which \(n\) value was used in final Barlat91 fit for multiphase bainitic-ferrite–retained-austenite structure.
First tensile behavior in x direction was evaluated relative to experimental curve. Then additional tension–compression and shear-dominated loading paths were numerically applied with same crystal-plasticity parameters. These numerical yield points were used to identify Barlat91 surface.
Main result of yield surfaces
Surfaces in Figure 11 are not circular. This indicates microstructure gives direction-dependent plastic response that cannot be fully represented by isotropic von Mises criterion.
General ordering of yield-surface size is:
- 673 K, 0,5 s−1: largest surface and highest model yield resistance,
- 723 K, 0,5 s−1,
- 673 K, 0,25 s−1,
- 723 K, 0,25 s−1: smallest surface.
Lower temperature and faster heat extraction expanded yield surface outward through higher transformation driving force, faster microstructure formation and higher internal stresses.
Why is yielding behavior anisotropic?
Study links anisotropy to four microstructural factors:
- Directional and elongated form of bainitic ferrite plates,
- Unequal volume fractions of 24 Kurdjumov–Sachs variants,
- Variant-dependent transformation strains,
- Heterogeneous residual stresses in microstructure.
When load is applied parallel, perpendicular or in shear direction relative to ferrite plates, different slip systems and phase-boundary constraints may activate. Thus yield resistance depends not only on total ferrite fraction but also loading direction.
Why did temperature effect decrease in shear-dominated loading?
In some shear-dominated regions of yield surface, 673 and 723 K curves approached each other. Researchers explain this by shear loading activating broader group of crystal orientations and reducing effect of one dominant morphological direction.
Especially at 0,5 s−1, similar volume fractions of certain Kurdjumov–Sachs variants numbered 2, 4, 9, 10, 13, 15, 20 and 23 may contribute to convergence of collective response in shear direction. This explanation is model-based interpretation and was not tested by multiaxial experiment.
Strengths of study
- Laboratory steel was produced and chemical composition measured.
- Two controlled isothermal bainite treatments were applied.
- Microstructure and uniaxial tensile behavior were experimentally examined.
- Phase transformation, carbon diffusion, latent heat and mechanical interaction were combined in one framework.
- Three-dimensional microstructure represented 24 crystal variants and retained austenite.
- Simulation overestimation of ferrite thickness was explicitly reported.
- Local internal stresses were stated not to be macroscopic tensile stress.
- Transition from uniaxial validation to multiaxial prediction was explained as model-based.
- Integrated link between heat treatment, microstructure and yield surface was established.
Limitations of study
- Study has not undergone peer review.
- Only one steel composition was examined.
- Only 673 and 723 K isothermal holding temperatures were experimentally compared.
- Simulation quantitatively overestimated bainitic ferrite thickness.
- Simulated area and length distributions were not experimentally validated.
- Internal stresses were not measured with X-ray, neutron diffraction or microstrain method.
- Damage, cracking and fracture mechanisms were not included in model.
- Only uniaxial tensile response in x direction was experimentally evaluated.
- Multiaxial yield surfaces and shear response were not experimentally validated.
- Number of tensile-test repeats and uncertainty calculation were not explained.
- Details of EBSD or inverse-pole-figure map production were not given.
- Full numerical values of Barlat91 parameters and inverse-identification details were not presented.
- Units of stress and hardening parameters in Table 5 appear inconsistent.
- Time step, total computation time, hardware and convergence study for phase-field calculations were not reported.
- No open repository link for data and code was provided.
What does study support?
- Lower isothermal temperature is associated with finer bainitic ferrite and higher yield strength in this steel.
- Phase-field model can qualitatively capture temperature-dependent ferrite-thickness trend.
- Heat-extraction coefficient can affect transformation rate and internal-stress development.
- Fast transformation can generate higher local transformation stresses.
- 673 K treatment produced higher experimental yield strength than 723 K treatment.
- Phase-field/crystal-plasticity model reproduced experimental uniaxial strength ordering.
- Simulated bainitic microstructure shows direction-dependent yielding behavior.
- Barlat91 can represent anisotropic yield points obtained from model with a macroscopic surface.
What does study not prove?
- It does not prove that 673 K and 0,5 s−1 is overall best heat treatment in real production.
- It does not show calculated local internal stresses have same magnitude in real steel.
- It does not experimentally validate multiaxial yield surfaces.
- It does not prove model can be directly transferred to other steel compositions.
- It does not show higher tensile strength guarantees higher toughness, fatigue life or wear resistance.
- It does not experimentally track retained-austenite transformation to martensite during deformation.
- It does not resolve industrial-scale temperature gradients, part geometry or furnace variability.
- It does not prove Barlat91 experimentally superior to von Mises, Hill48 or other criteria.
Engineering meaning
Most important contribution is attempt to resolve intermediate microstructural mechanisms instead of relating heat-treatment temperature only to final hardness or tensile strength. If such framework is developed, manufacturer could numerically screen before physically testing every possible heat treatment:
- Bainite transformation rate,
- Ferrite thickness and orientation,
- Retained-austenite distribution,
- Local internal-stress regions,
- Yield resistance in different loading directions
.
However this study is not yet fully industrial “virtual materials laboratory”. Absolute microstructure dimensions, multiaxial mechanical response and local stresses require broader experimental validation.
Усул ва бозёфтҳои таҳқиқот
Technical summary of research design
| Method component | Approach applied in study |
|---|---|
| Study type | Experimental steel production, microstructure characterization, tensile testing and multiphysics numerical modeling |
| Steel composition | Fe–0,19C–1,48Si–2,38Mn weight percent; low amounts of P, S, Cr, Mo, Al and Cu |
| Ingot | 80 kg, produced by vacuum induction |
| Austenitization | Ac3 + 60 K, 300 seconds |
| Isothermal treatments | 673 and 723 K, 45 minutes |
| Microstructure method | SEM; inverse pole figure maps also presented but EBSD details not given |
| Tensile test | B5×25 specimen, 5 mm diameter, 25 mm gauge length, 0,001 s−1 |
| Phase-field domain | 128 µm cube, 0,1 µm regular grid |
| Initial temperature | 900 K |
| Heat-extraction conditions | 0,25 and 0,5 s−1 |
| Thermal model | Newton cooling law with latent heat |
| Mechanical model | Finite deformation, crystal plasticity and FFT-based mechanical solver |
| Yield model | Barlat91 anisotropic phenomenological yield function |
| Experimentally tested loading path | Uniaxial tension in x direction |
| Additional model-based loading paths | Tension–compression and shear-dominated multiaxial states |
| Open code | Not provided |
| Data access | Stated to be available from authors upon reasonable request |
Main quantitative findings
- Experimental bainitic-ferrite thickness at 673 K is 0,15 ± 0,05 µm.
- Experimental bainitic-ferrite thickness at 723 K is 0,26 ± 0,08 µm.
- 673 K phase-field result is 0,341 µm.
- 723 K phase-field result is 0,382 µm.
- Experimental yield strength at 673 K is 765 ± 5 MPa.
- Experimental yield strength at 723 K is 667 ± 5 MPa.
- Lower-temperature treatment provided approximately 98 MPa higher experimental yield strength.
- Simulations using 0,25 s−1 gave results closest to experimental tensile curves.
- Simulations using 0,5 s−1 produced higher model strength and higher internal stress.
- Largest calculated yield surface belongs to 673 K and 0,5 s−1.
- Upper scale in internal-stress maps is approximately 1,3 GPa; this is local model stress.
Scientific function of figures
| Figure | Content shown | Scientific function |
|---|---|---|
| Graphical abstract | Cooling curves, 3D variant maps, tensile curves and yield surface | Summarize process–microstructure–property chain |
| Figure 1 | Experimental SEM microstructures at 673 and 723 K | Show finer ferrite formation at lower temperature |
| Figure 2 | Four three-dimensional phase-field microstructures | Show effects of temperature and heat-extraction coefficient on variant and retained-austenite distribution |
| Figure 3 | Four temperature–time curves | Show bath temperature, heat-extraction rate and latent-heat effects |
| Figure 4 | Bainitic-ferrite volume fraction | Compare transformation path and final phase fraction |
| Figure 5 | Inverse pole figure maps | Show experimental variant and morphology differences |
| Figure 6 | Boxplots of area, aspect ratio, length and thickness | Quantify simulated morphology |
| Figure 7 | Local von Mises stress maps | Show post-transformation stress heterogeneity |
| Figure 8 | Experimental and calculated tensile curves | Evaluate uniaxial mechanical behavior |
| Figure 9 | Model yield points and Barlat91 fit | Show representational ability of phenomenological yield surface |
| Figure 10 | Volume fractions of 24 Kurdjumov–Sachs variants | Show crystal-variant basis for loading-direction-dependent behavior |
| Figure 11 | Four yield surfaces | Compare modeled effect of heat treatment on strength and anisotropy |
Technical inconsistencies within source
- In Table 5 units of stress parameters together with given numerical values produce physically unusual magnitudes.
- Hardening equations use exponent \(a\), while Table 5 gives “Hardening Index m”; relationship between two symbols is not explained.
- Separate \(n\) values are given for BCC and FCC in Barlat91, but selected value in macroscopic fit of two-phase microstructure is not reported.
- EBSD experimental conditions for inverse pole figure maps are not provided.
- Although title emphasizes experimental validation, multiaxial yield behavior is model-based, not experimental.
Careful interpretation of findings
Study shows effect of heat-treatment temperature on experimental microstructure thickness and uniaxial yield strength at reliable trend level. Phase-field model reproduces this trend, but has not yet achieved quantitative accuracy in absolute ferrite thickness.
Internal-stress and multiaxial-yield-surface results are valuable for investigating physical mechanisms and designing new experiments. However, because they were not directly measured, they should be treated as model predictions requiring experimental testing, not validated material data.
Ёддошти манбаъ ва усул
Full original title of study: Experimentally validated process–microstructure–property relations of bainitic steels derived from phase-field simulations
Authors: Dhanunjaya Kumar Nerella, Muhammad Adil Ali, Oguz Gulbay, Oleg Shchyglo and Ingo Steinbach.
Author order: Preserved as given in source.
Co-first author: No equal contribution or co-first authorship information is provided.
Corresponding author: Dhanunjaya Kumar Nerella.
Contact address: Uploaded text does not contain email address. Official Ruhr University Bochum researcher record gives `dhanunjaya.nerella@rub.de`.
Institution 1: Interdisciplinary Centre for Advanced Materials Simulation, Ruhr University Bochum, Universitätsstraße 150, 44801 Bochum, North Rhine-Westphalia, Germany.
Institution 2: Steel Institute, RWTH Aachen University, Intzestraße 1, 52072 Aachen, North Rhine-Westphalia, Germany.
Official source link:Official SSRN record page
Publication platform: SSRN.
Submission date: 3 July 2026.
Publication year: 2026.
Journal: No specific journal name or acceptance information appears in this version.
Publisher: Text carries phrase “Preprint submitted to Elsevier”; however no specific Elsevier journal or accepted publication record is identified.
Source type: Preprint research article combining experimental heat treatment, microstructure characterization and tensile testing with three-dimensional phase-field, crystal-plasticity and phenomenological yield-surface modeling.
Peer-review status: Study has not undergone peer review.
Author contributions: This version does not contain separate CRediT or task-based author-contribution statement.
Funding: Research was supported by Germany Federal Ministry of Research, Technology and Space under DiStEL project, project number 13XP5226E.
Conflict of interest: No separate conflict-of-interest or competing-interests statement appears in this version.
Data access: Phase-field simulation data are stated to be available from authors upon reasonable request. No open-data repository link is provided.
Code access: Source code, software version used, run scripts or reproduction package were not shared.
Experimental-validation boundary: Experimental comparison is limited to microstructure-thickness trend and uniaxial tensile response in x direction. Internal stresses, other loading directions and Barlat91 multiaxial surfaces are model-based predictions.
Morphology-validation boundary: Phase-field model captured temperature-dependent thickening trend but overestimated ferrite thickness especially at 673 K. Simulated area and length distributions were not compared with experimental data.
Source-consistency warning: Stress and hardening units in crystal-plasticity parameter table give magnitudes requiring explanation. Barlat91 exponent selection and EBSD measurement conditions are also unclear. These points are stated without silently correcting source.
Ин Tajik content дар асоси experimental methods, equations, tables, microstructure images, stress maps ва mechanical results-и uploaded study омода шудааст. No industrial production success, fatigue performance, toughness increase, part safety ё Turkey-specific mechanical-property claim absent from study илова нашудааст.
Шарҳ гузоред
Нишонии почтаи электронии шумо нашр намешавад. Майдонҳои ҳатмӣ бо * нишон дода шудаанд