

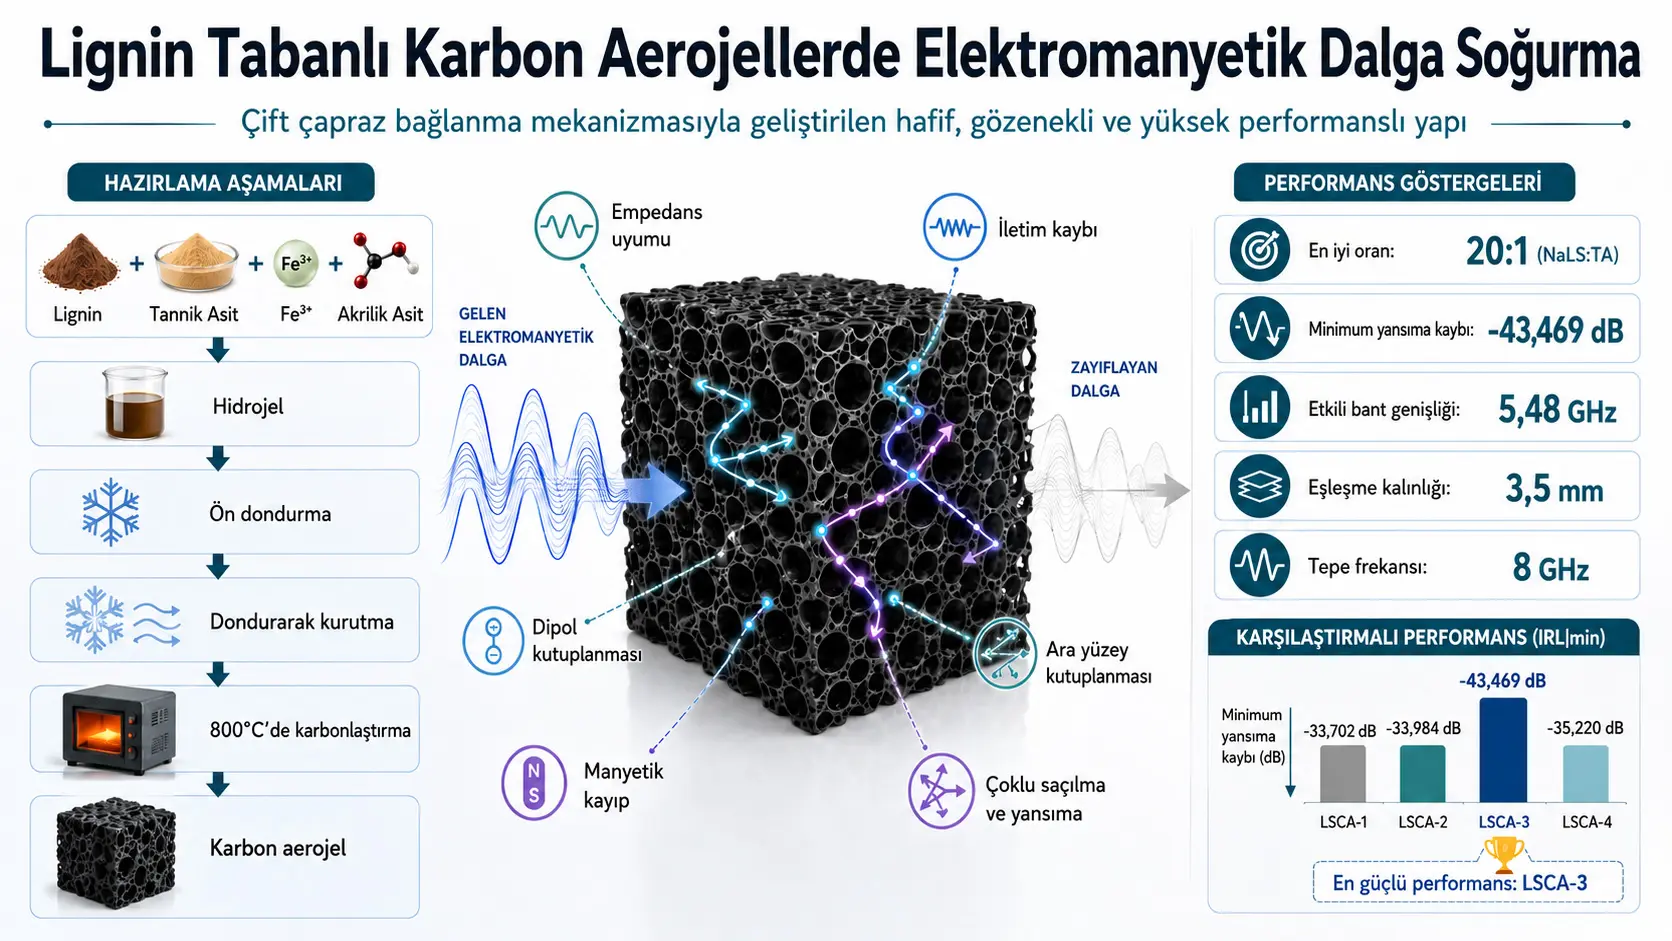
Ин таҳқиқот бо мақсади беҳтар кардани қобилияти фурӯбарии мавҷҳои электромагнитӣ дар carbon aerogels-и ковоки аз sodium lignosulfonate гирифташуда, системаи hydrogel-и дорои dual cross-linking-ро тарҳрезӣ кардааст. Шабакаи якуми система аз metal-phenolic coordination structure, ки байни iron ions ва phenolic groups-и tannic acid ва lignin ташаккул меёбад; шабакаи дуюм бошад аз radical polymerization-и acrylic acid иборат аст. Hydrogel-ҳои омодашуда аз pre-freezing, freeze-drying ва carbonization at 800 °C for two hours гузаронида шуданд.
Mass ratio байни sodium lignosulfonate ва tannic acid ба 1:1, 10:1, 20:1 ва 50:1 тағйир дода шуд; carbon aerogels-и ҳосилшуда LSCA-1, LSCA-2, LSCA-3 ва LSCA-4 номгузорӣ шуданд. Balanced micro-, meso- and macroporous structure-и беҳтарин дар LSCA-3 бо ratio 20:1 мушоҳида шуд. Total pore volume-и ин sample 0,9866 cm³/g, mesopore volume 0,245 cm³/g ва specific surface area 1885,580 m²/g гузориш шудааст. Highest specific surface area бошад дар LSCA-2 бо 1986,603 m²/g measured шудааст.
Дар electromagnetic measurements, LSCA-3 at matching thickness 3,5 mm ва frequency 8 GHz ба minimum reflection loss-и −43,469 dB расид. Effective absorption bandwidth 5,48 GHz дода шудааст. Researchers ин result-ро бо combined effect-и multiple reflection and scattering paths extended inside pores, conduction loss in carbon skeleton, dipole polarization arising from defects and functional groups, Maxwell-Wagner polarization at carbon-air interfaces, limited magnetic loss provided by iron components ва suitable impedance matching шарҳ медиҳанд.
Study нишон медиҳад, ки lignin-based carbon aerogels метавонанд барои lightweight and broadband electromagnetic-wave absorbers candidate бошанд. Бо вуҷуди ин, filler ratio of sample in paraffin шарҳ дода нашудааст, repeated measurements and error values дода нашудаанд, mechanical strength and environmental stability омӯхта нашудаанд ва validation on a real electronic device or coating анҷом дода нашудааст. Statements about being “environmentally friendly” and “low cost” ҳам бо life-cycle or cost analysis дастгирӣ нашудаанд.
Аз нигоҳи Туркия: Табдил додани lignin by-products, ки метавонанд аз paper, cellulose, wood-processing and biomass sectors-и Туркия ба даст оянд, ба electromagnetic-protection materials метавонад дар electronics, telecommunications, defense, aviation, automotive and technical-textile fields як research direction-и high-value-added эҷод кунад. Барои татбиқи approach дар Туркия, chemical composition of local lignin sources бояд муайян карда шавад; hydrogel formulation, carbonization atmosphere, filler ratio, mechanical strength, humidity-temperature durability, fire behavior and performance on real composite or textile surfaces бояд validated шаванд. Аз ин study хулоса баровардан мумкин нест, ки material бевосита барои истифода дар 5G devices, radar systems, military platforms ё products protecting human health омода аст.
Масъалаи таҳқиқот чист?
Паҳншавии electronic devices, wireless-communication infrastructure, 5G systems ва Internet of Things applications electromagnetic-wave density in the environment ва interference risk between electronic systems-ро зиёд мекунад. Ин як engineering problem эҷод мекунад, ки метавонад operation of sensitive devices-ро affected кунад ва ба electromagnetic-compatibility problems оварда расонад.
Аз electromagnetic-wave-absorbing material одатан чунин properties интизор мешаванд:
- Low density and low total weight,
- Ability of incoming waves to enter material without reflecting from surface,
- Consumption of electromagnetic energy inside material through different loss mechanisms,
- Absorption over a wide frequency range,
- Sufficient performance at low thickness,
- Ability to be produced from inexpensive and sustainable raw materials.
Carbon aerogels дорои low density, high porosity and large specific surface area мебошанд. Аммо pure carbon structures метавонанд excessive electrical conductivity нишон диҳанд. Дар ин ҳолат impedance difference between air and material зиёд шуда, substantial portion of electromagnetic waves метавонад аз surface баргардад. Main loss mechanism of pure carbon dielectric loss аст; absence of magnetic loss метавонад broadband absorption-ро маҳдуд кунад.
Чаро lignin интихоб шуд?
Lignin яке аз natural polymers-и aromatic structure in plant cell walls аст ва метавонад дар processes such as cellulose-paper production ба миқдори зиёд ҳамчун by-product ҳосил шавад. Ба шарофати aromatic carbon structure онро метавон carbonize карда ба porous carbon materials табдил дод.
Дар study sodium lignosulfonate истифода шуд. Researchers мегӯянд, ки ин raw material:
- From renewable biomass origin будан,
- Having phenolic and other functional groups,
- Ability to coordinate with metal ions,
- Ability to be used as carbon-aerogel precursor,
- Providing an alternative to conventional high-cost carbon precursors
бо ҳамин сабабҳо интихоб шудааст.
Dual cross-linking mechanism чист?
Figure 2 on page 5 нишон медиҳад, ки дар hydrogel structure ду different networks ҳамзамон formed шудаанд.
Metal-phenolic network
Fe3+ ions бо phenolic groups of tannic acid ва suitable functional groups on lignin coordination bonds ташкил медиҳанд. Ҳамин тавр physical-chemical network аз Fe3+-TA and Fe3+-lignin connections ба вуҷуд меояд.
Radical-polymerization network
Acrylic acid бо ёрии persulfate initiator polymerize шуда polyacrylic-acid chains ҳосил мекунад; attachment to lignin structure or interchain entanglement шабакаи дуюмро ташкил медиҳад.
Interpenetration of these two networks баъд аз freeze-drying of hydrogel a three-dimensional porous skeleton боқӣ мегузорад. Researchers пешниҳод мекунанд, ки бо changing sodium lignosulfonate/tannic acid ratio density of metal-phenolic network ва бинобар ин pore structure of final carbon aerogel-ро танзим кардан мумкин аст.
Materials
- Sodium lignosulfonate,
- Tannic acid,
- Acrylic acid,
- Ferric chloride hexahydrate, FeCl3·6H2O,
- Persulfate-based radical initiator,
- 1 mol/L sodium hydroxide solution for pH adjustment.
Дар source номи initiator ва abbreviation-и он consistent нест. Дар materials section “ammonium persulphate (KPS)” навишта шудааст, while in orthogonal design and mechanism schematic “APS” used шудааст. KPS and APS same abbreviation нестанд; exact persulfate salt actually used in study ба таври равшан clarified нашудааст.
Preparation process
- Solution containing sodium lignosulfonate and tannic acid prepared шуд.
- pH бо 1 mol/L NaOH ба range 8–10 adjusted шуд.
- 0,09 g ferric chloride hexahydrate, 0,2 g persulfate initiator and 2 mL acrylic acid ба mixture added шуданд.
- Mixture until gel formation mixed шуд.
- Hydrogel at −20 °C for 24 hours pre-frozen шуд.
- Frozen hydrogel for 48 hours freeze-dried шуд.
- Resulting aerogel in tube furnace at 800 °C for two hours carbonized шуд.
Study carbonization atmosphere, inert-gas type and flow rate, heating rate, cooling rate, initial solution volume, fixed tannic-acid amount and actual sodium-lignosulfonate mass used for each ratio-ро намедиҳад. Ин omissions independent reproduction of production-ро маҳдуд мекунанд.
Чаро orthogonal experimental design истифода шуд?
Аз сабаби мавҷудияти multiple components in hydrogel system, four-factor three-level orthogonal experimental design татбиқ шуд. Evaluation criterion minimum reflection loss, RLmin, интихоб шуд.
| Factor | Level 1 | Level 2 | Level 3 |
|---|---|---|---|
| A — NaLS:TA ratio | 1:1 | 10:1 | 50:1 |
| B — Fe3+ amount | 0,03 g | 0,06 g | 0,09 g |
| C — Acrylic acid | 1,7 mL | 2,0 mL | 2,7 mL |
| D — Persulfate initiator | 0,15 g | 0,20 g | 0,25 g |
Although table says “Fe3+ amount”, it is not explained whether given masses correspond to elemental Fe3+ amount or FeCl3·6H2O mass.
Results of nine orthogonal experiments
| Experiment | NaLS:TA | Fe component | AA | Initiator | RLmin |
|---|---|---|---|---|---|
| 1 | 1:1 | 0,03 g | 1,7 mL | 0,15 g | −43,19 dB |
| 2 | 1:1 | 0,06 g | 2,0 mL | 0,20 g | −37,03 dB |
| 3 | 1:1 | 0,09 g | 2,7 mL | 0,25 g | −52,61 dB |
| 4 | 10:1 | 0,03 g | 2,0 mL | 0,25 g | −25,00 dB |
| 5 | 10:1 | 0,06 g | 2,7 mL | 0,15 g | −15,00 dB |
| 6 | 10:1 | 0,09 g | 1,7 mL | 0,20 g | −43,52 dB |
| 7 | 50:1 | 0,03 g | 2,7 mL | 0,20 g | −18,33 dB |
| 8 | 50:1 | 0,06 g | 1,7 mL | 0,25 g | −40,08 dB |
| 9 | 50:1 | 0,09 g | 2,0 mL | 0,15 g | −39,20 dB |
According to range analysis, order of factor effects given as:
\[ A\,(16{,}44) > B\,(16{,}27) > C\,(13{,}61) > D\,(6{,}77) \]
This result shows NaLS:TA ratio corresponds to highest variation among examined factors. However ranges of A and B factors are very close. Study notes Fe amount can change both pore structure and magnetic properties, leaves this factor for separate future research and systematically varies only NaLS:TA ratio in subsequent experiments.
An important interpretation limit exists: strongest reflection loss among nine experiments is −52,61 dB. In subsequent controlled-ratio series LSCA-3 called “best” gives −43,469 dB. Therefore LSCA-3 is not absolute most-negative RL value in entire study; it is merely most balanced and broadest-band sample within four-ratio series where other components held constant. Study does not express this scope difference clearly enough.
Four controlled samples
| Sample | Sodium lignosulfonate:tannic acid ratio |
|---|---|
| LSCA-1 | 1:1 |
| LSCA-2 | 10:1 |
| LSCA-3 | 20:1 |
| LSCA-4 | 50:1 |
SEM images чӣ нишон медиҳанд?
Figure 3 on page 11 compares surfaces of four samples at 1 µm and 500 nm scales.
LSCA-1
Overlapping flake-like structures and sparse irregular pores observed. Some small pores were interpreted as merging with larger voids and reducing micro- and mesopore volume.
LSCA-2
Smoother surfaces, elliptical and elongated irregular pores observed. Although micropore amount and specific surface area are high, mesopore volume remains low relative to other samples.
LSCA-3
Displayed dense honeycomb-like structure. Smaller pores on inner walls of large pores formed macro-meso-micro hierarchy described as “pore within pore”.
LSCA-4
Surface became denser and smoother, number of distinct large pores decreased. Researchers linked this to agglomeration of excess sodium lignosulfonate and thickening of carbon walls.
General trend is that pore amount first increases as sodium-lignosulfonate ratio increases, then decreases after 20:1 ratio.
Specific surface area and pore volumes
| Sample | Specific surface area | Micropore volume | Mesopore volume | Total pore volume |
|---|---|---|---|---|
| LSCA-1 | 1592,793 m²/g | 0,610 cm³/g | 0,190 cm³/g | 0,8219 cm³/g |
| LSCA-2 | 1986,603 m²/g | 0,774 cm³/g | 0,173 cm³/g | 0,9734 cm³/g |
| LSCA-3 | 1885,580 m²/g | 0,721 cm³/g | 0,245 cm³/g | 0,9866 cm³/g |
| LSCA-4 | 1619,205 m²/g | 0,609 cm³/g | 0,191 cm³/g | 0,8070 cm³/g |
LSCA-2 has highest specific surface area and micropore volume. LSCA-3 shows highest mesopore volume and total pore volume. Researchers argue that high surface area alone is not sufficient; balance among pores of different sizes is more important for electromagnetic wave to enter material and scatter inside.
One paragraph in source says LSCA-3 has “largest specific surface area and total pore volume”. Table 4 does not confirm surface-area part: highest surface area is in LSCA-2. LSCA-3 is first only in total and mesopore volume.
Nitrogen adsorption-desorption analysis
Pore distribution showed strong peak in 0–2 nm region and important part of structure was stated to consist of micropores. In 2–5 nm region LSCA-3 was observed to have more developed mesopore distribution.
Isotherms were interpreted as combining Type I behavior characteristic of micropores with Type IV/H1 hysteresis features indicating mesopores and capillary condensation. Coexistence of these two behaviors presented as evidence of hierarchical pore structure.
Raman result
For LSCA-3, D band at approximately 1350 cm−1 and G band at 1585 cm−1 observed. Intensity ratio:
\[ I_D/I_G=0{,}99 \]
was given. D band represents disorder and defects, while G band represents sp²-bonded graphitic carbon structure. Ratio close to 1 interpreted as balance between conductive graphitic regions and defects that can contribute to polarization.
Since Raman graph shown only for LSCA-3, effect of sodium-lignosulfonate/tannic-acid ratio on graphitization degree cannot be directly compared. Also iron proposed to provide “catalytic graphitization”, but without iron-free control sample this effect was not independently demonstrated.
XRD and EDS results
In XRD pattern peak around 2θ = 52,5° at (110) associated with crystalline Fe phase, while peak around 30,4° at (002) associated with carbon structure. Researchers propose iron did not remain as ionic or amorphous clusters after carbonization but transformed into crystalline particles.
Reported atomic percentages in EDS map:
| Element | Atomic percentage |
|---|---|
| Carbon | %94,42 |
| Oxygen | %4,63 |
| Iron | %0,96 |
Iron appeared relatively uniformly distributed within image area. However XRD and EDS do not determine size, exact phase composition, oxidation state or saturation magnetization of magnetic particles. Without additional measurements such as VSM, XPS, TEM or Mössbauer, statements “homogeneous distribution of magnetic particles” and “strong magnetic loss” rely on limited evidence.
Problem in FTIR reporting
Methods section gives FTIR measurement range 4000–5000 cm−1. Lower and upper limits do not correspond to usual full-spectrum scan and no FTIR graph or functional-group result is presented. Therefore actual FTIR range and contribution of results to mechanism interpretation cannot be determined.
How were electromagnetic parameters measured?
Carbon-aerogel powder mixed with paraffin and pressed into concentric rings with inner diameter 3 mm and outer diameter 7 mm. AV 3672B vector network analyzer used to measure relative complex permittivity and relative complex permeability over 2–18 GHz.
Sample/paraffin mass ratio described as “a certain ratio” but not numerically specified. Since filler ratio directly affects measured ε and μ values, this omission is critical for reproducing performance and comparing with other studies.
Reflection loss
Reflection loss calculated by:
\[ RL=20\log_{10}\left|\frac{Z-1}{Z+1}\right| \]
Here Z represents normalized input impedance of material. As RL becomes more negative, reflected signal from surface is considered to decrease.
| Sample | Matching thickness | Peak frequency | RLmin | Effective bandwidth |
|---|---|---|---|---|
| LSCA-1 | 2,0 mm | 12,40 GHz | −33,702 dB | 3,68 GHz |
| LSCA-2 | 2,5 mm | 11,36 GHz | −33,984 dB | 3,60 GHz |
| LSCA-3 | 3,5 mm | 8,00 GHz | −43,469 dB | 5,48 GHz |
| LSCA-4 | 2,5 mm | 10,40 GHz | −35,220 dB | 4,16 GHz |
LSCA-3 provided both most-negative minimum reflection loss and widest reported bandwidth among four controlled samples. Study does not explicitly define RL threshold used for “effective absorption bandwidth”. Therefore exact mathematical limit used to calculate 5,48 GHz cannot be reconstructed from source.
Dielectric loss
Real part ε′ of complex permittivity associated with ability to store electromagnetic energy, imaginary part ε″ with ability to dissipate energy through electrical losses.
Dielectric loss tangent:
\[ \tan\delta_\varepsilon=\frac{\varepsilon''}{\varepsilon'} \]
defined as above.
ε′ and ε″ generally decreased with increasing frequency, while curves showed multiple peaks and fluctuations. These were associated with different polarization relaxations. Defects in carbon skeleton, polar groups and carbon-air interfaces were cited as sources of different relaxation processes.
Cole-Cole analysis
Source writes Cole-Cole relation as:
\[ (\varepsilon''-\varepsilon_0)^2+(\varepsilon'')^2=(\varepsilon_s-\varepsilon_\infty)^2 \]
Using ε″ in both squared terms makes equation nonfunctional as an ε′–ε″ semicircle relation. Expected radius scaling and center terms on right side are also unexplained. Because equation appears this way in source, it has not been corrected; Cole-Cole curves cannot be independently reproduced using given expression.
Multiple irregular arcs in graphs interpreted as presence of multiple non-Debye relaxations, interfacial polarization and conduction loss. Linear sections in tails associated with conductive loss.
Magnetic loss
Magnetic loss tangent:
\[ \tan\delta_\mu=\frac{\mu''}{\mu'} \]
defined as above.
Study shows negative μ″ values at some frequencies. Researchers explain this as energy exchange between electric field generated within material and magnetic energy. However interpretation cannot be made definitive because measurement calibration, sample homogeneity, fixture correction and reproducibility of negative μ″ values are not reported.
Magnetic loss tangent stated to be markedly smaller than dielectric loss tangent. This indicates total absorption mainly depends on dielectric losses and magnetic contribution of iron is secondary.
Eddy-current coefficient
For eddy-current assessment study uses:
\[ C_0=\mu''(\mu')^{-2}f^{-1} \]
Expression. C0 remaining frequency-independent is interpreted as eddy-current loss being dominant.
C0 curves showed pronounced fluctuations over 0–6 GHz and became more linear over 6–18 GHz. Researchers proposed magnetic loss arises not solely from eddy current but combined effects of natural resonance, exchange resonance and eddy current.
Impedance matching
Normalized input impedance calculated by:
\[ Z=\frac{Z_{\mathrm{in}}}{Z_0}=\sqrt{\frac{\mu_r}{\varepsilon_r}}\tanh\left(\frac{j\pi f d}{c}\sqrt{\mu_r\varepsilon_r}\right) \]
Here:
- Zin: Input impedance of material,
- Z0: Impedance of free space,
- μr: Complex relative permeability,
- εr: Complex relative permittivity,
- f: Frequency,
- d: Material thickness,
- c: Speed of light.
|Zin/Z0| approaching 1 used to mean impedance difference between air and material decreases and wave can enter material rather than reflect from surface.
Among four samples LSCA-3 shown to approach 1 most at certain thicknesses and frequencies. LSCA-3 attenuation coefficient is not highest at every frequency; nevertheless more balanced impedance matching produced best overall reflection loss. This shows not only high loss capacity but also wave entry into material is important.
Attenuation coefficient
Source gives attenuation coefficient as:
\[ \alpha=\frac{\sqrt{2}\pi f}{c}\sqrt{(\mu''\varepsilon''-\mu'\varepsilon')+\sqrt{(\mu''\varepsilon''-\mu'\varepsilon')^2+(\mu''\varepsilon'+\mu'\varepsilon'')^2}} \]
α represents degree to which electromagnetic wave entering material loses energy. Curves showed frequency-increasing behavior with multiple resonance peaks.
Quarter-wavelength approach
Matching thickness given by:
\[ t_m=\frac{nc}{4f_m\sqrt{|\varepsilon_r||\mu_r|}} \]
Here tm is matching thickness, fm frequency of absorption peak and n coefficient not defined in source.
Figure 8 on page 22 compares calculated theoretical thicknesses with thicknesses of experimental reflection-loss peaks. Closeness of curves interpreted as shift of absorption peaks to lower frequencies with increasing thickness being consistent with quarter-wavelength interference.
In this mechanism phase difference of waves reflected from front and back surfaces of material forms so they partially cancel each other; remaining energy entering material is consumed through dielectric and magnetic losses.
Proposed electromagnetic-wave absorption mechanism
Figure 9 on page 23 summarizes proposed mechanism under six main components:
- Impedance matching: Hierarchical pores adjust effective electrical properties and facilitate wave entry into material.
- Conduction loss: Charges moving in carbonized skeleton dissipate energy through electrical resistance.
- Dipole polarization: Structural defects and polar functional groups reorient under alternating electromagnetic field and produce loss.
- Interfacial polarization: Charge accumulation occurs at heterogeneous regions such as carbon-air and iron-carbon.
- Multiple reflection and scattering: Porous channels lengthen wave path and increase number of interactions within material.
- Magnetic loss: Iron-containing particles provide additional attenuation through natural resonance, exchange resonance and eddy current.
Study’s own data show dielectric loss stronger than magnetic loss. Therefore material’s success should be explained less as being “a strong magnetic absorber” and more by suitable impedance matching of hierarchical porous carbon structure together with multiple dielectric-loss mechanisms.
Strengths of study
- Renewable lignin derivative used as actual carbon precursor.
- Metal-phenolic network and radical polymerization applied together.
- Multiple formulations screened through orthogonal experimental design.
- Four different sodium-lignosulfonate/tannic-acid ratios systematically compared.
- SEM and BET data support changes in pore structure.
- Balance of micro-, meso- and macropores associated with performance.
- Electromagnetic properties examined across broad 2–18 GHz range.
- Reflection loss shown with two- and three-dimensional maps for different thicknesses.
- Impedance matching and attenuation capacity evaluated separately.
- Thickness-frequency relation examined using quarter-wavelength approach.
Main limitations of study
- Study is preprint not peer reviewed.
- Independent production replicate for each formulation not stated.
- No standard deviation, error bar or confidence interval in electromagnetic measurements.
- No analysis of variance or statistical-significance test for orthogonal experiment results.
- Actual sodium-lignosulfonate and tannic-acid masses used in hydrogel preparation not provided.
- Carbonization atmosphere, gas flow rate and heating rate not explained.
- Persulfate initiator inconsistent as APS or KPS.
- FTIR measurement range questionable and no FTIR result presented.
- Sample mass ratio in paraffin not provided.
- RL threshold for effective bandwidth not defined.
- Cole-Cole equation written incorrectly or incompletely.
- Most Raman, XRD and EDS analyses shown only for LSCA-3.
- Without iron-free control, catalytic and magnetic contribution of iron cannot be separated.
- Magnetic hysteresis or saturation magnetization not measured.
- Size and exact phase composition of Fe particles not determined.
- Measurement reproducibility of negative μ″ values not examined.
- Bulk density or actual weight advantage of material not provided.
- Compression strength, flexibility, brittleness and machinability not measured.
- Humidity, temperature, oxidation and long-term-use stability not examined.
- No test on real coating, textile, polymer composite or electronic system.
- Electromagnetic-interference shielding effectiveness not measured.
- No production-cost or life-cycle assessment.
Important inconsistencies in source
- Although orthogonal experiment obtained −52,61 dB, results present −43,469 dB as “optimal”; two optimization scopes not clearly separated.
- Table 4 gives highest specific surface area for LSCA-2, while text states LSCA-3 has highest surface area.
- Expression “ammonium persulphate, KPS” in materials section is inconsistent with APS abbreviation in tables.
- FTIR range given as 4000–5000 cm−1, but no FTIR result shown.
- In Cole-Cole equation ε″ term used twice to represent two different axes.
- Although text emphasizes “magnetic loss”, tanδμ values are stated to be much smaller than tanδε values.
- Abstract claims iron prevents agglomeration and provides catalytic graphitization, but no direct comparative control is presented.
- Final application referred to as “electromagnetic shielding”, yet study measured reflection loss rather than shielding effectiveness.
Which conclusions are supported by study?
- Lignin-based hydrogel and carbon aerogel can be produced through dual cross-linking.
- Sodium-lignosulfonate/tannic-acid ratio changes pore morphology.
- 20:1 ratio produced most balanced hierarchical pore structure.
- LSCA-3 reached highest total and mesopore volume.
- LSCA-2 has highest specific surface area and micropore volume.
- Carbonized LSCA-3 showed XRD peak consistent with crystalline Fe and widespread Fe distribution.
- Among four controlled samples LSCA-3 provided best reflection loss and bandwidth.
- LSCA-3 gave −43,469 dB RLmin at 3,5 mm thickness and 8 GHz.
- Pore balance, impedance matching and dielectric loss are associated with performance.
- Change of absorption peaks with thickness is consistent with quarter-wavelength approach.
Which conclusions are not proven?
- Does not prove material is superior to commercial electromagnetic-protection products.
- Does not show −43,469 dB value will reproduce across different laboratories.
- Does not show actual density of material is low or structurally robust.
- Does not prove iron creates a strong magnetic-loss phase through direct magnetic measurements.
- Does not confirm catalytic graphitization originates from iron.
- Does not show material will work in real 5G, radar or microwave devices.
- Does not establish electromagnetic-shielding effectiveness of material.
- Does not quantitatively show production is low cost or environmentally superior.
- Does not prove laboratory-scale freeze-drying is economical at industrial scale.
- Does not show material is stable under long-term humidity, temperature and mechanical load.
Усул ва бозёфтҳои таҳқиқот
Technical method summary
| Method component | Approach used in study |
|---|---|
| Carbon precursor | Sodium lignosulfonate |
| Phenolic ligand | Tannic acid |
| Metal-ion source | FeCl3·6H2O |
| Polymerized monomer | Acrylic acid |
| Cross-linking | Metal-phenolic coordination and radical polymerization |
| pH | 8–10 |
| Pre-freezing | −20 °C, 24 hours |
| Freeze-drying | 48 hours |
| Carbonization | 800 °C, 2 hours |
| Carbonization atmosphere | Not reported |
| Orthogonal design | Four factors, three levels, nine experiments |
| Controlled ratios | 1:1, 10:1, 20:1 and 50:1 |
| SEM | Morphology examination after gold coating |
| Raman | 532 nm laser |
| XRD | Co-Kα; 40 kV, 40 mA; 5–90°; 10°/minute |
| BET | Degassing at 300 °C for 8 hours; N2 adsorption at 77 K |
| Pore calculations | BET, BJH and DFT methods |
| Electromagnetic measurement | Coaxial method and AV 3672B vector network analyzer |
| Frequency range | 2–18 GHz |
| Sample geometry | Concentric ring, inner diameter 3 mm, outer diameter 7 mm |
| Paraffin filler ratio | Not reported |
| Statistical analysis | Range analysis; repeats and ANOVA not reported |
Summary of structural findings
| Criterion | Highlighted sample or value |
|---|---|
| Highest specific surface area | LSCA-2, 1986,603 m²/g |
| Highest micropore volume | LSCA-2, 0,774 cm³/g |
| Highest mesopore volume | LSCA-3, 0,245 cm³/g |
| Highest total pore volume | LSCA-3, 0,9866 cm³/g |
| Raman ID/IG | 0,99 for LSCA-3 |
| EDS Fe amount | %0,96 atomic |
| Most balanced hierarchical structure | LSCA-3 |
Electromagnetic-performance summary
| Criterion | Best reported result |
|---|---|
| Best sample in controlled series | LSCA-3 |
| NaLS:TA ratio | 20:1 |
| Matching thickness | 3,5 mm |
| Peak frequency | 8 GHz |
| Minimum reflection loss | −43,469 dB |
| Effective bandwidth | 5,48 GHz |
| Primary loss type | Dielectric loss |
| Secondary loss type | Iron-associated magnetic loss |
| Main structural advantage | Micro-meso-macro pore balance |
Structure-property relation determining performance
| Structural feature | Proposed electromagnetic effect | Evidence level |
|---|---|---|
| Micropores | High interfacial area and polarization | Supported by BET and pore distribution |
| Mesopores | Multiple scattering and more balanced impedance | Associated with LSCA-3 performance |
| Macropores | Wave propagation into material | Interpretation based on SEM images |
| Carbon defects | Dipole polarization | Raman ID/IG result is indirect evidence |
| Conductive carbon network | Conduction loss | Interpreted from electromagnetic parameters |
| Fe particles | Magnetic resonance and eddy current | Presence supported by XRD and EDS; magnetism not directly measured |
| Suitable thickness | Destructive interference and reduced reflection | Supported by quarter-wavelength plots |
Statistical and reproducibility assessment
Study used range analysis in orthogonal factor screening. However independent repeat count of experiments, measurement uncertainty of RL values, reproducibility of BET results and variability between independently produced batches were not provided.
Because RLmin is calculated from electromagnetic parameters, vector-network-analyzer calibration, dimensional tolerance of ring sample, homogeneity of paraffin mixture and filler ratio can affect results. No uncertainty analysis for these variables is available.
Therefore it can be said LSCA-3 showed best trend within controlled series; but it cannot be concluded that it is statistically superior to other samples or that −43,469 dB will remain same in repeated production.
Ёддошти манбаъ ва усул
Full original title of study: The Electromagnetic Wave Absorption Properties of Lignin-Based Carbon Aerogels Based on the Dual Cross-Linking Mechanism
Authors and correct order: Wanchao Sun, Hong Pan, Haidong Xu, Lihui Xu, Qun Yang, Hong Zhao, Chengjian Yao
Equal first author or equal contribution: No equal-first-authorship or equal-contribution statement in uploaded version.
Corresponding author: Hong Pan
Corresponding-author footnote: Source uses plural phrase “corresponding authors”; however only Hong Pan is marked with asterisk and only his email is provided.
Corresponding-author email: panhong@sues.edu.cn
Institutional affiliation: School of Textiles and Fashion, Shanghai University of Engineering Science, Shanghai 201620, China
ORCID: Uploaded version contains no ORCID information for authors.
Journal: Not published in a peer-reviewed journal.
Original journal publisher: None.
Publication platform: SSRN
Publication date: 28 July 2026. Date is based on resolving relative publication information in SSRN search record using 1 August 2026 as reference date.
Source type: Preprint research study including experimental hydrogel and carbon-aerogel production, material characterization and electromagnetic-wave absorption measurements
Peer-review status: Study has not undergone peer review. Every page contains “Preprint not peer reviewed” warning.
Official link:Official SSRN preprint page
Received, accepted and revision dates: Not present in uploaded version.
Funding: No funding statement in uploaded version.
Conflict of interest: No conflict-of-interest statement in uploaded version.
Data access: No repository or access link provided for raw vector-network-analyzer data, MATLAB calculation files, pore-analysis data and production recipes.
Author contributions: Author-contribution roles not specified in uploaded version.
Ин шарҳи тоҷикӣ бо examining text of study, four-layer preparation and mechanism schematics, three-level orthogonal experimental design, formulation and pore data in four tables, SEM images, nitrogen adsorption-desorption curves, Raman, XRD and EDS results, reflection-loss maps, electromagnetic-parameter graphs, impedance matching, attenuation coefficient and quarter-wavelength analysis омода шудааст.
External sources used only to bibliographically verify existence, title and publication timing of SSRN record. No new experimental result from external sources added to scientific findings of study.
Main limitations of study are lack of peer review, missing critical details in production recipe, absence of independent repeats and error analysis, unexplained paraffin filler ratio, inconsistencies in some equations and text, no direct magnetic-property measurement, absence of real-application and durability tests, and no quantitative validation of environmental-economic superiority claims.
Шарҳ гузоред
Нишонии почтаи электронии шумо нашр намешавад. Майдонҳои ҳатмӣ бо * нишон дода шудаанд